
AnalytEx
AnalytEx is Ex-Online’s built-in analytics. It provides dashboards and charts for defects and inspection data.
It visualizes that data so you can see trends, status, and comparisons across sites and projects.
Accessing AnalytEx
Section titled “Accessing AnalytEx”-
Open a project in the Tag Browser.
-
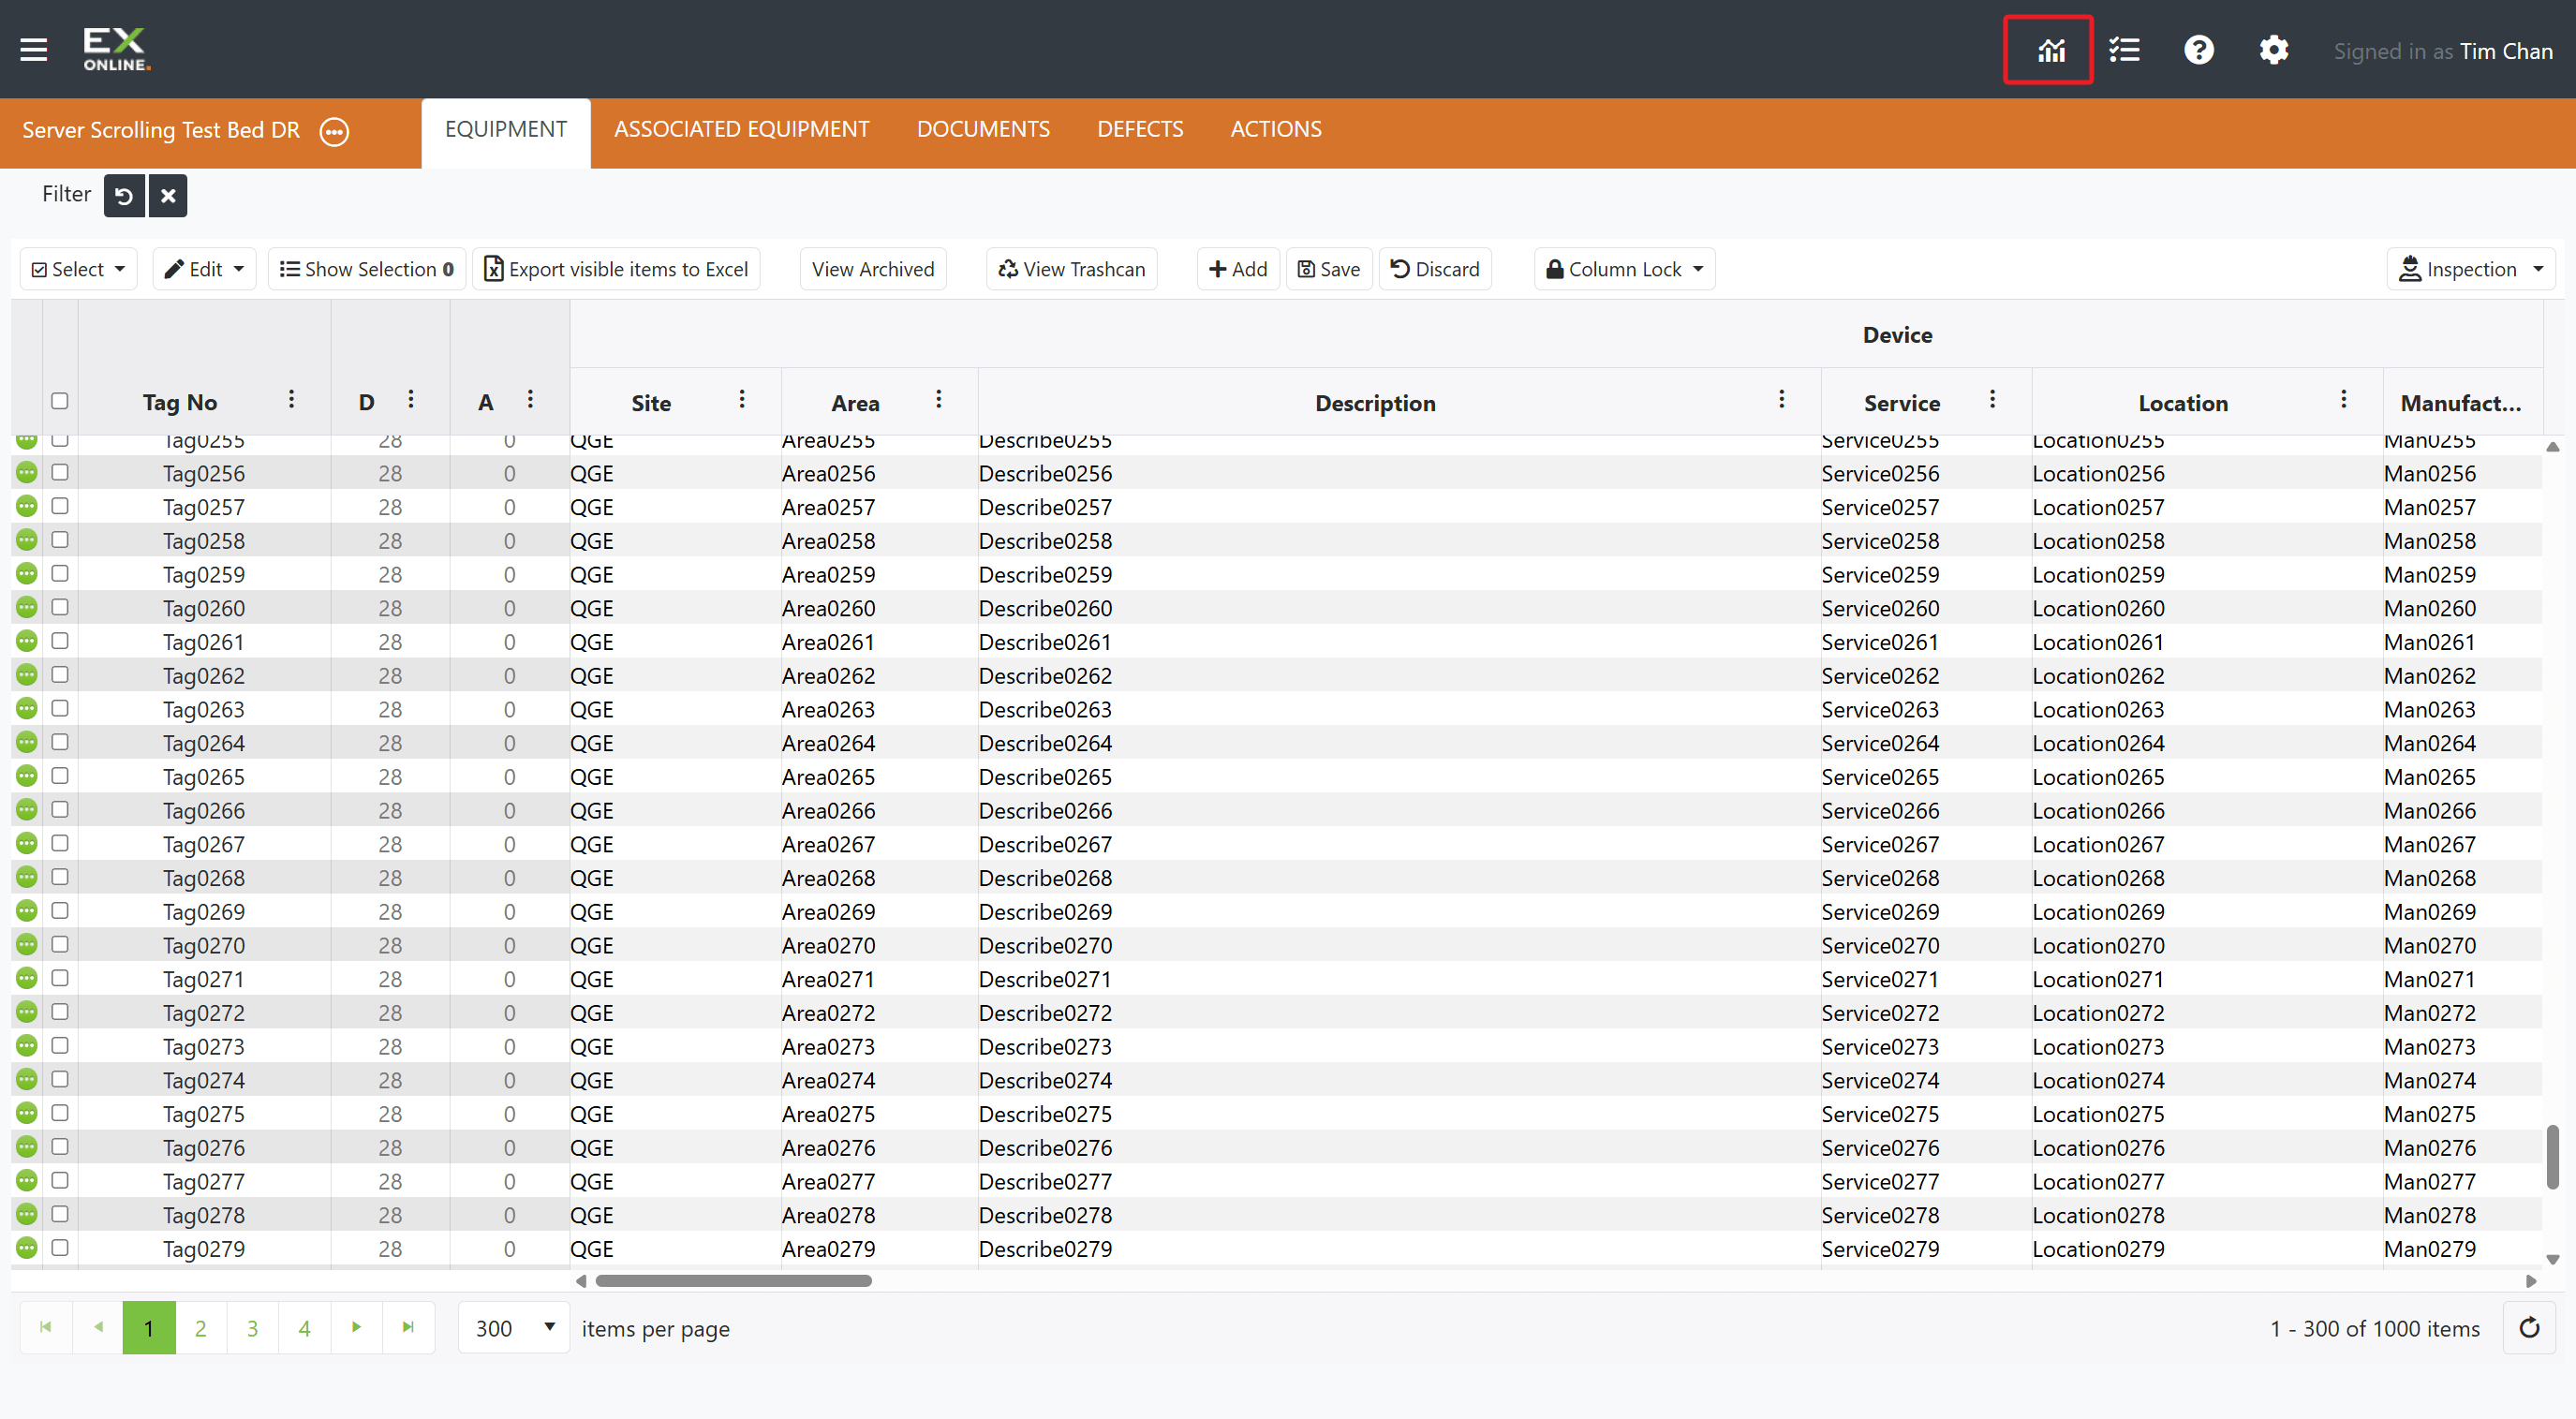
Click the AnalytEx icon in the toolbar (top right).
-
The AnalytEx home screen opens.
Dashboard Overview
Section titled “Dashboard Overview”The AnalytEx home screen provides quick access to several analytics views:
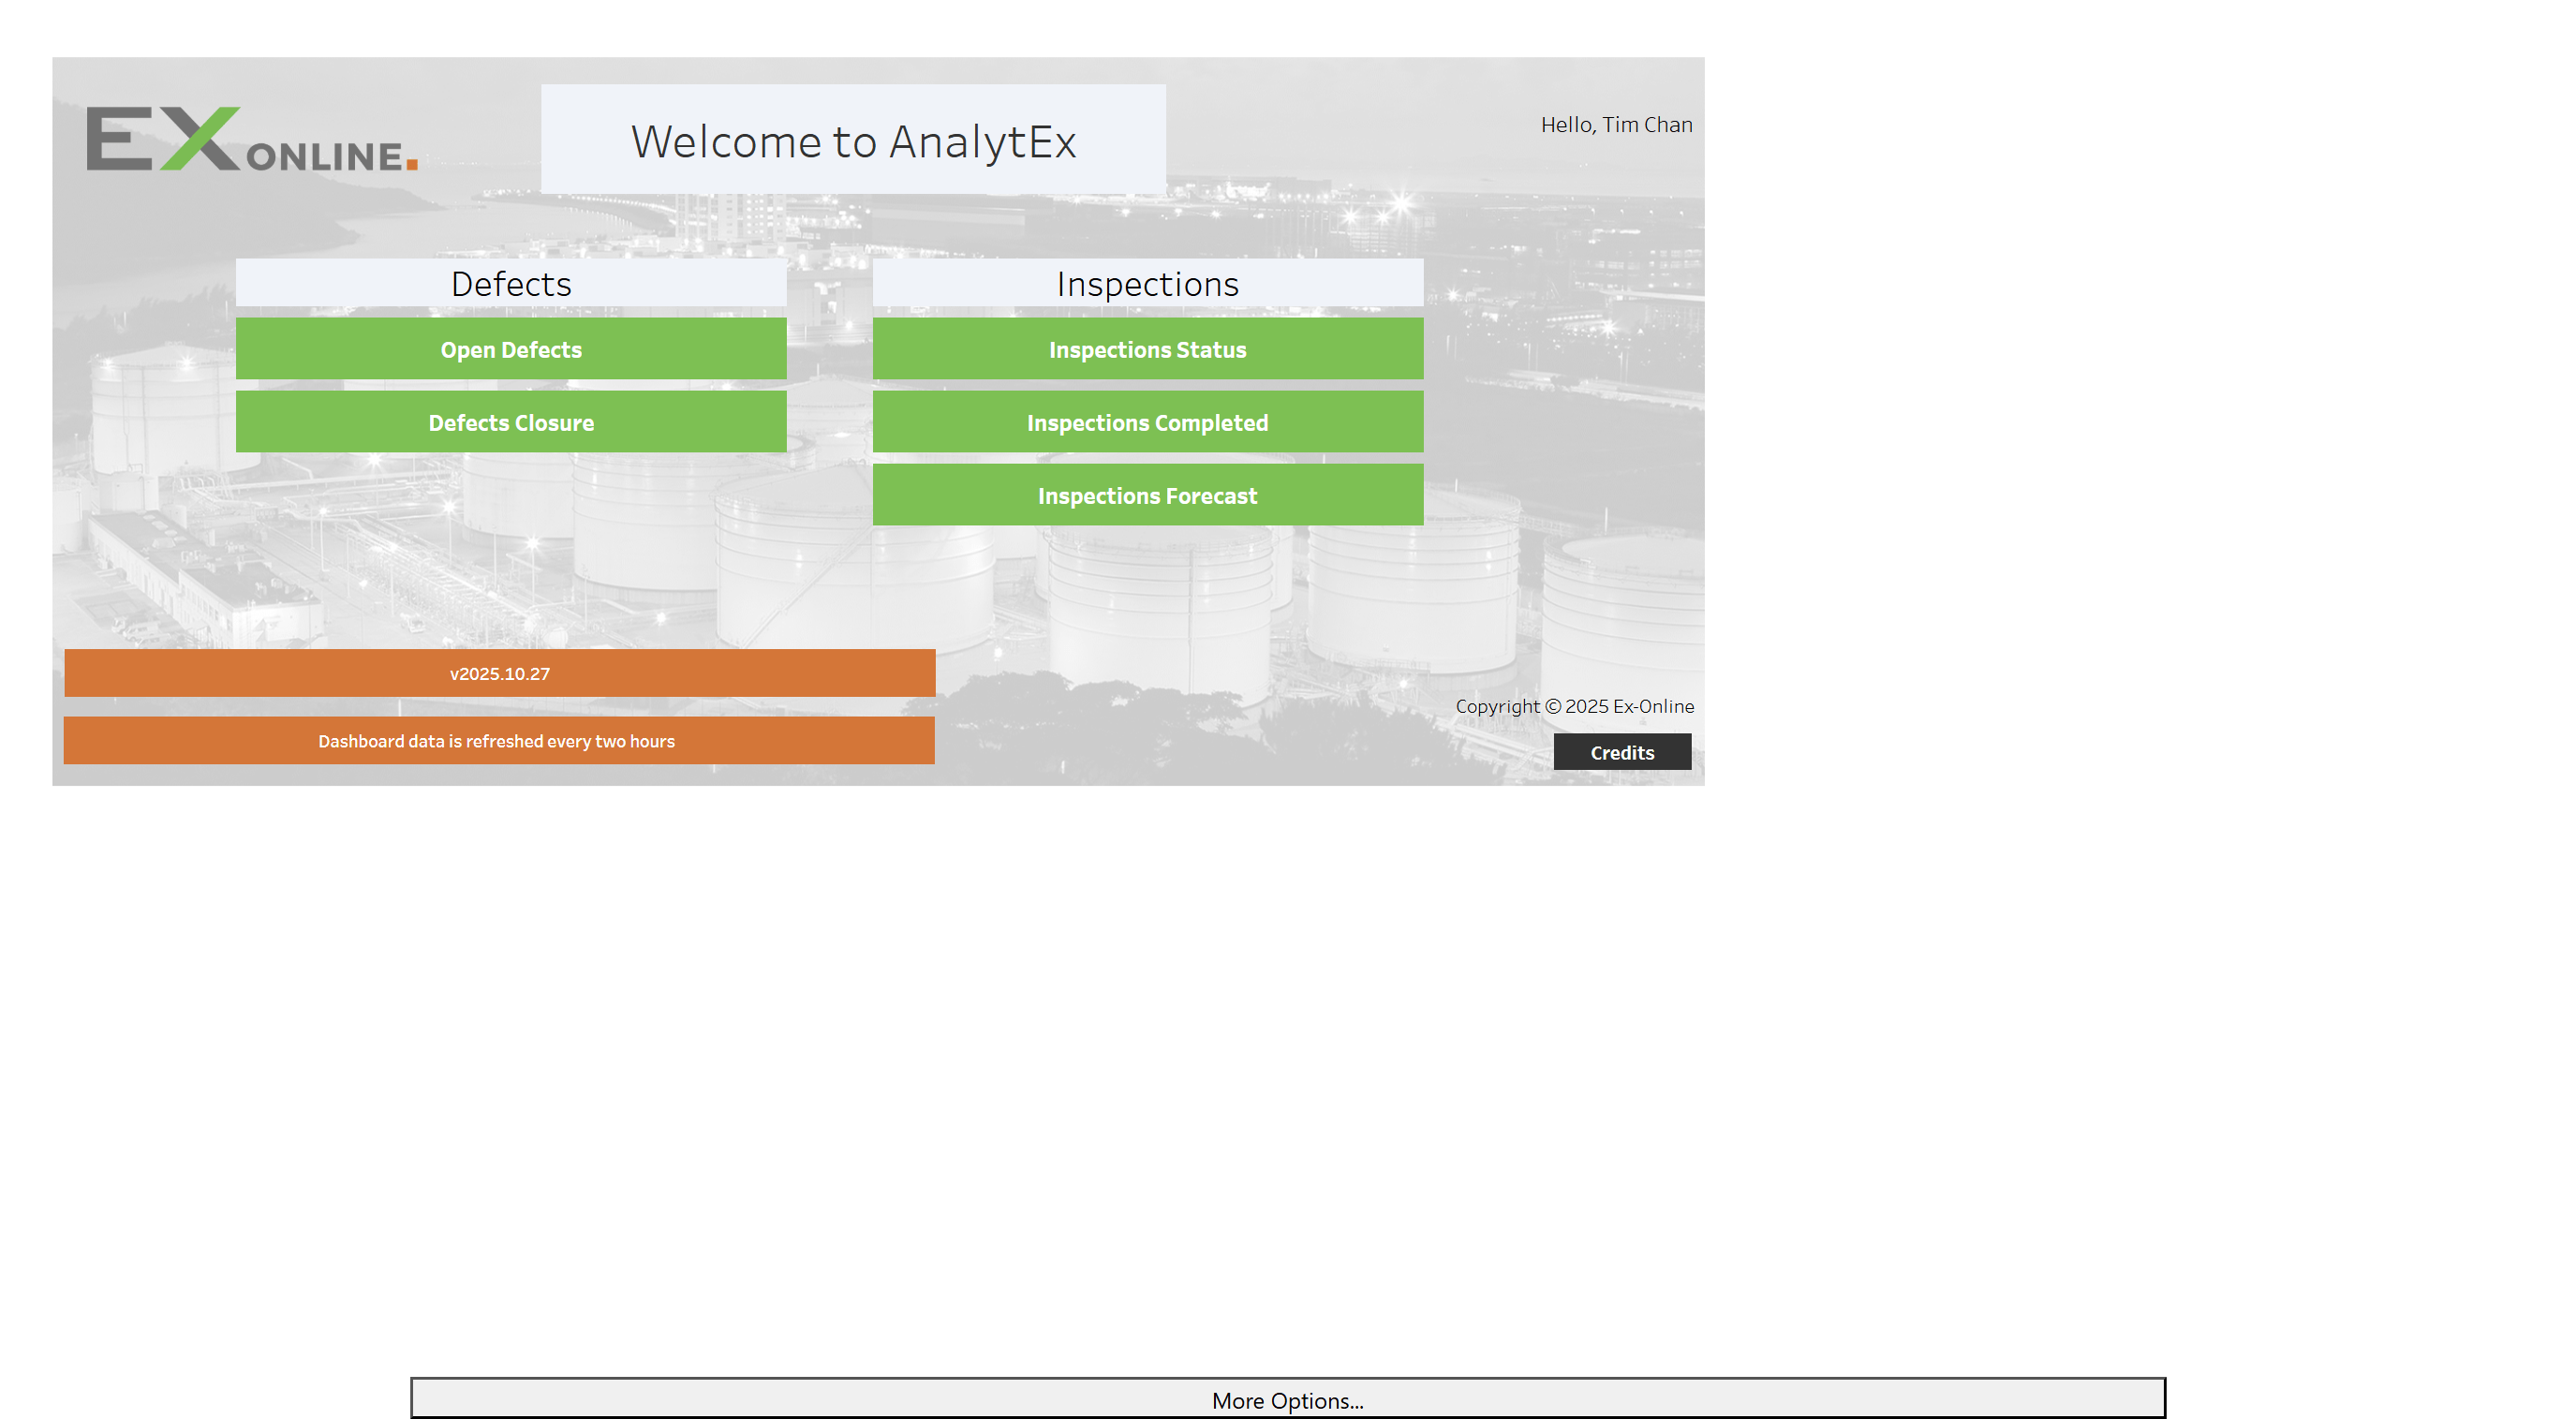
| Dashboard | Description |
|---|---|
| Open Defects | Summary of existing open defects across projects |
| Defects Closure | History of defects closed by project and year |
| Inspections Status | Overview of inspection timing and status by project |
| Inspections Completed | History of inspection uploads to Ex-Online |
| Inspections Forecast | Stacked area view of inspection due dates over time |
From the home screen, click a dashboard to open it in the embedded analytics view. Click the Home button (top right) to return to the AnalytEx home screen.
Key Features
Section titled “Key Features”Each dashboard lets you filter what you see, interact with charts, and use a toolbar at the bottom for actions such as undo and export. The subsections below explain each part.
Filtering
Section titled “Filtering”Use the filter row at the top of each dashboard to narrow what you see.
Filters usually include Account, Project, Job Number, Site, and Area.
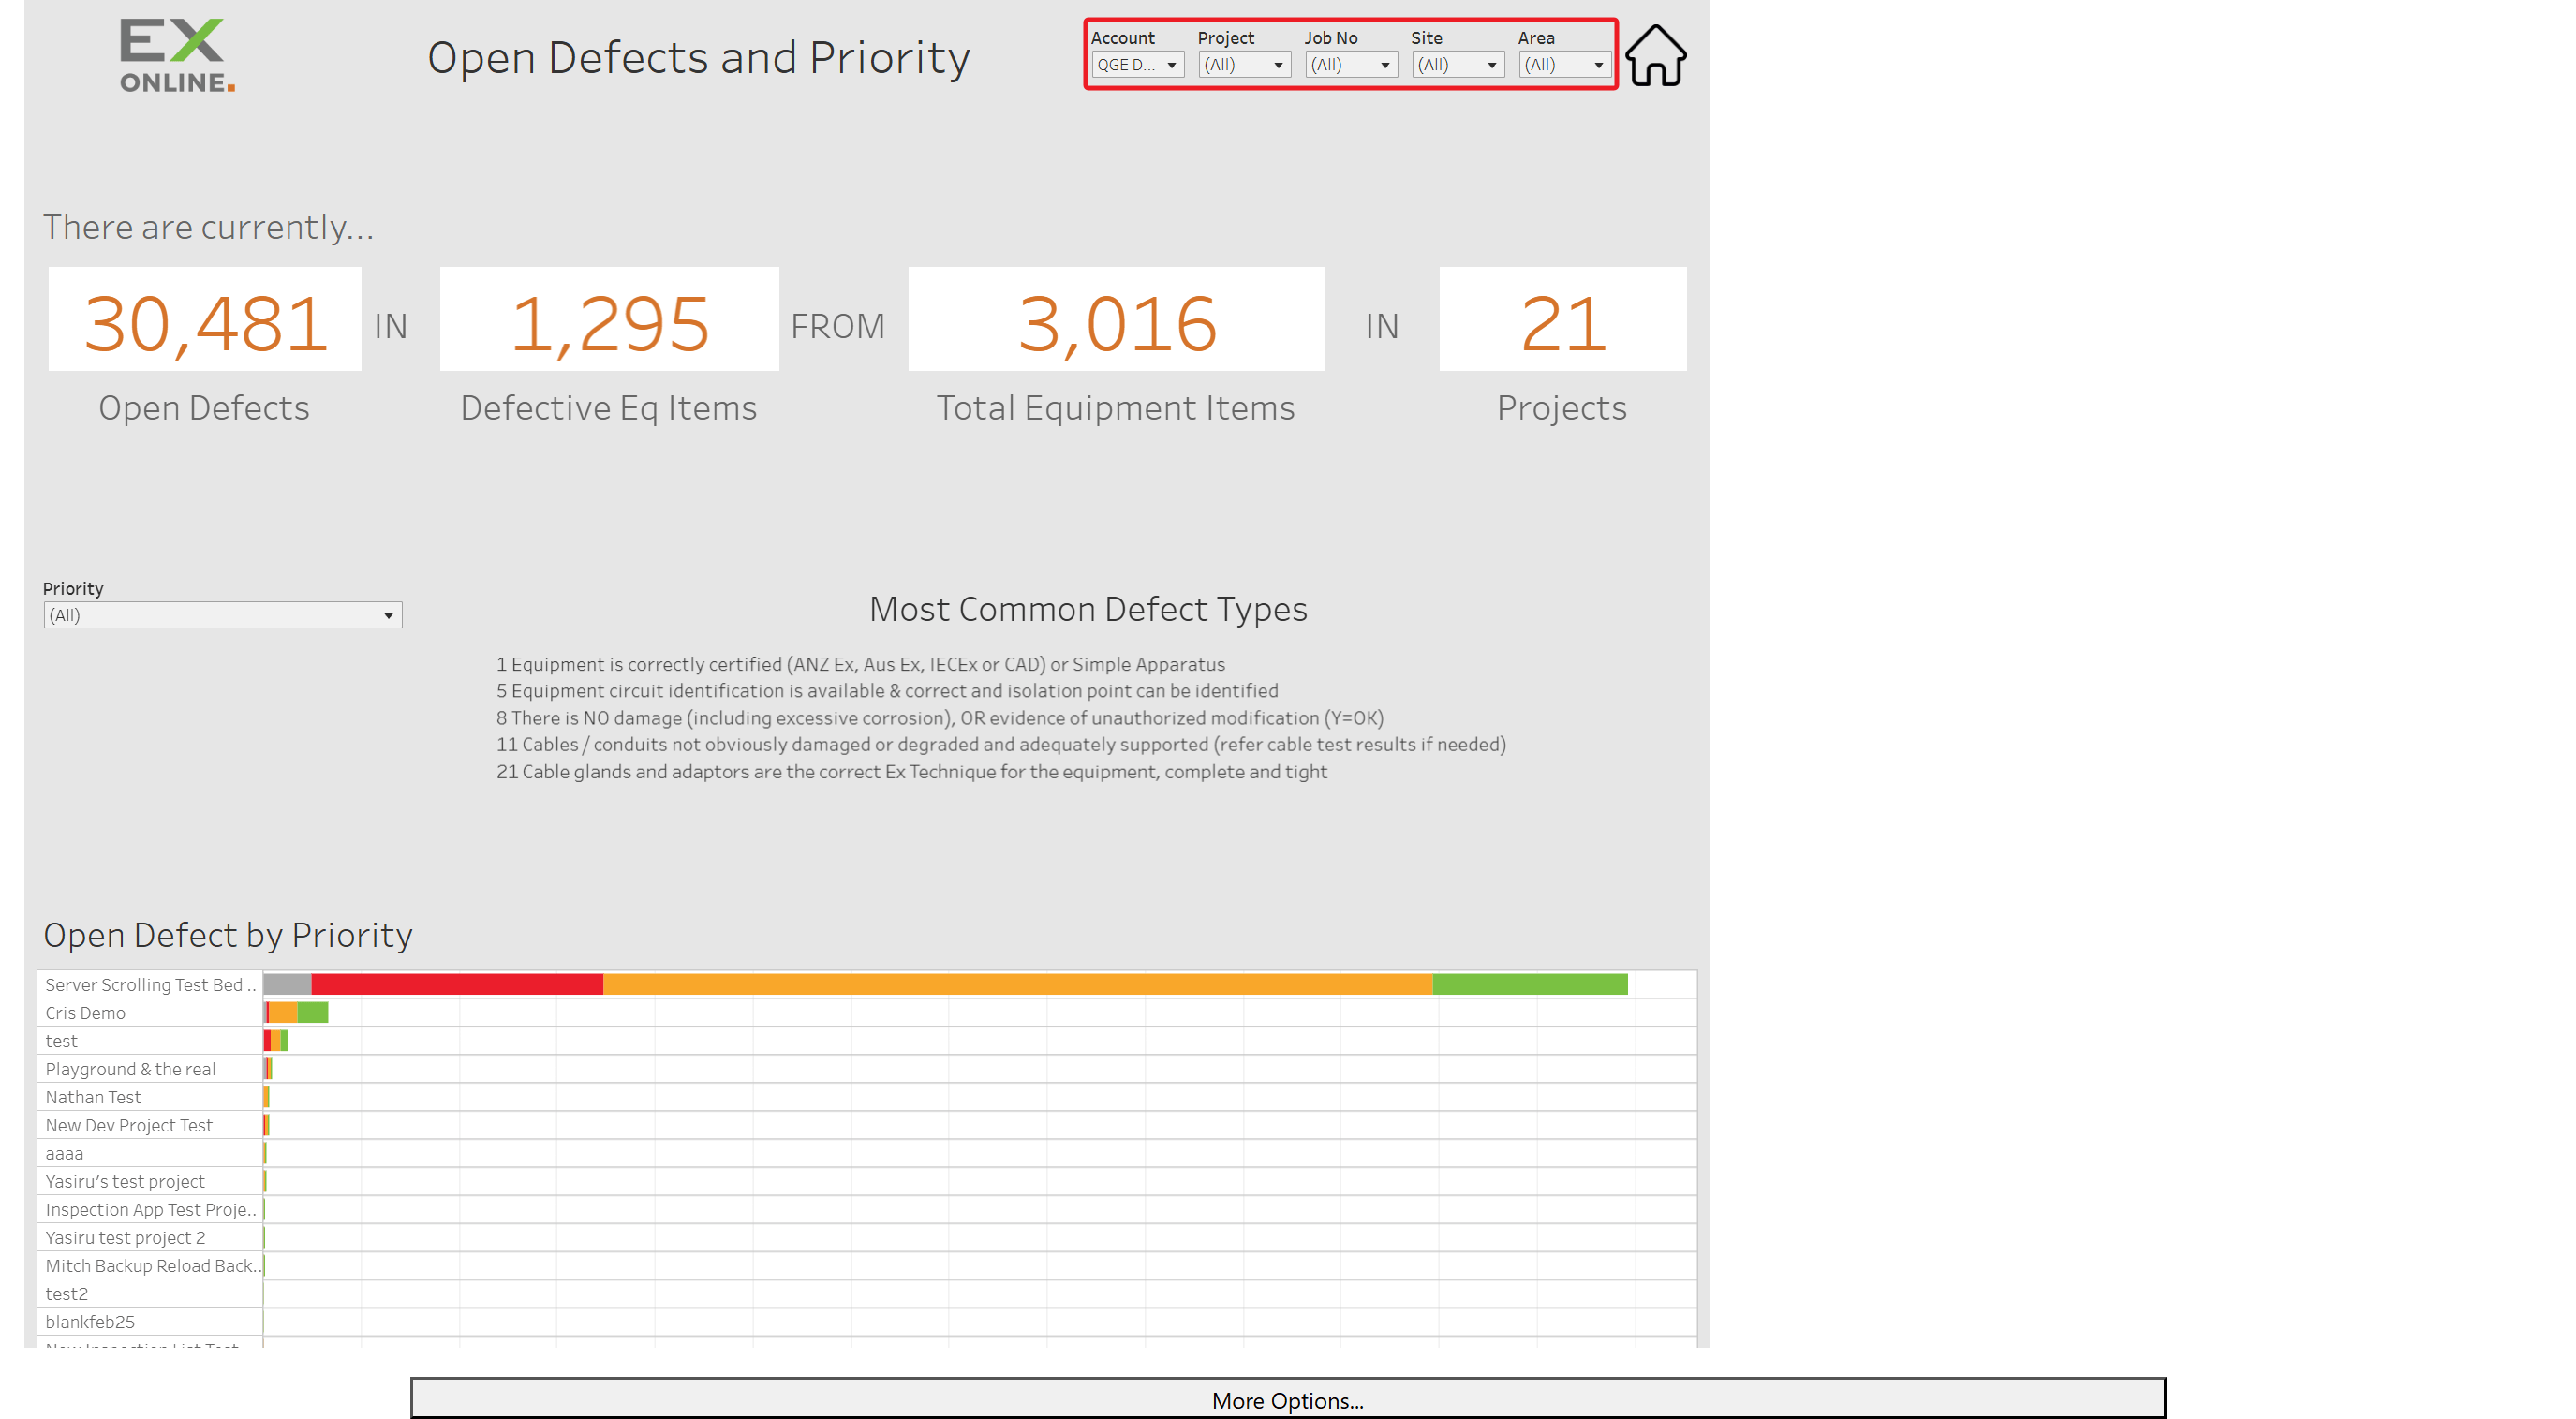
Use the drop-downs to change filters; the charts update automatically. It is often easiest to start broad, then narrow after you have scanned the full view.
Filter settings are remembered per dashboard—when you switch to another dashboard and come back, each one still has the filters you last set there.
Interactive Charts
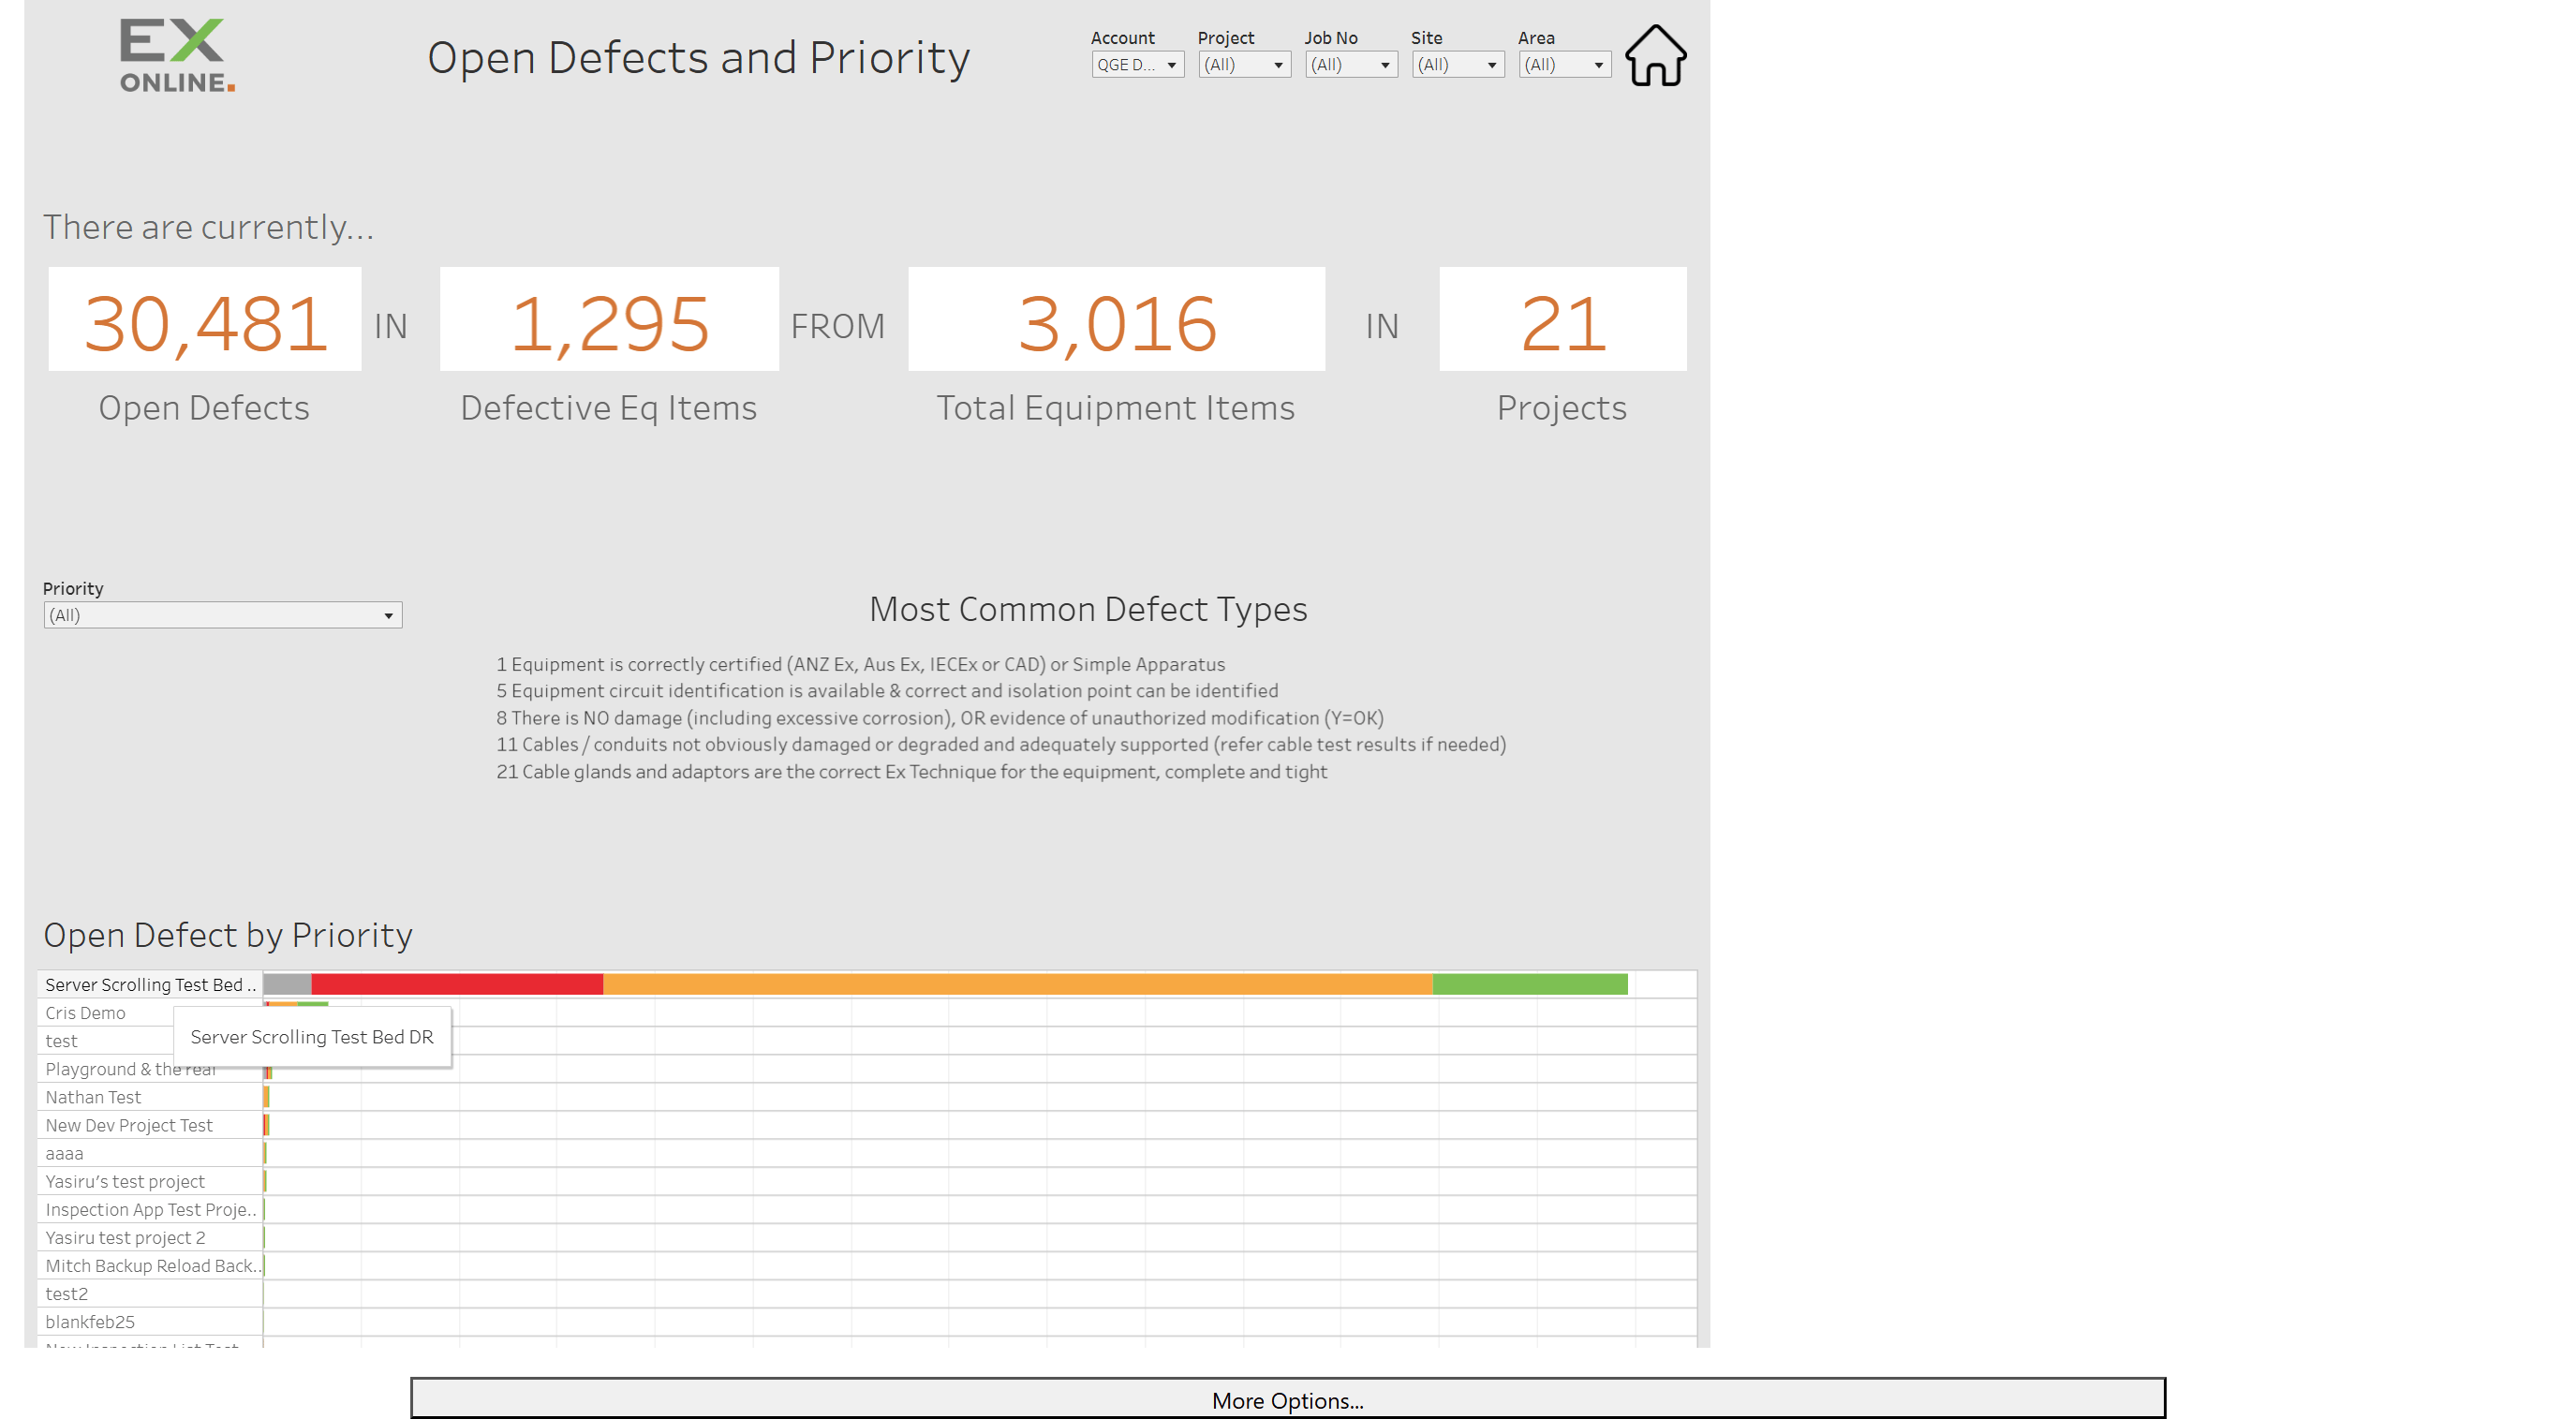
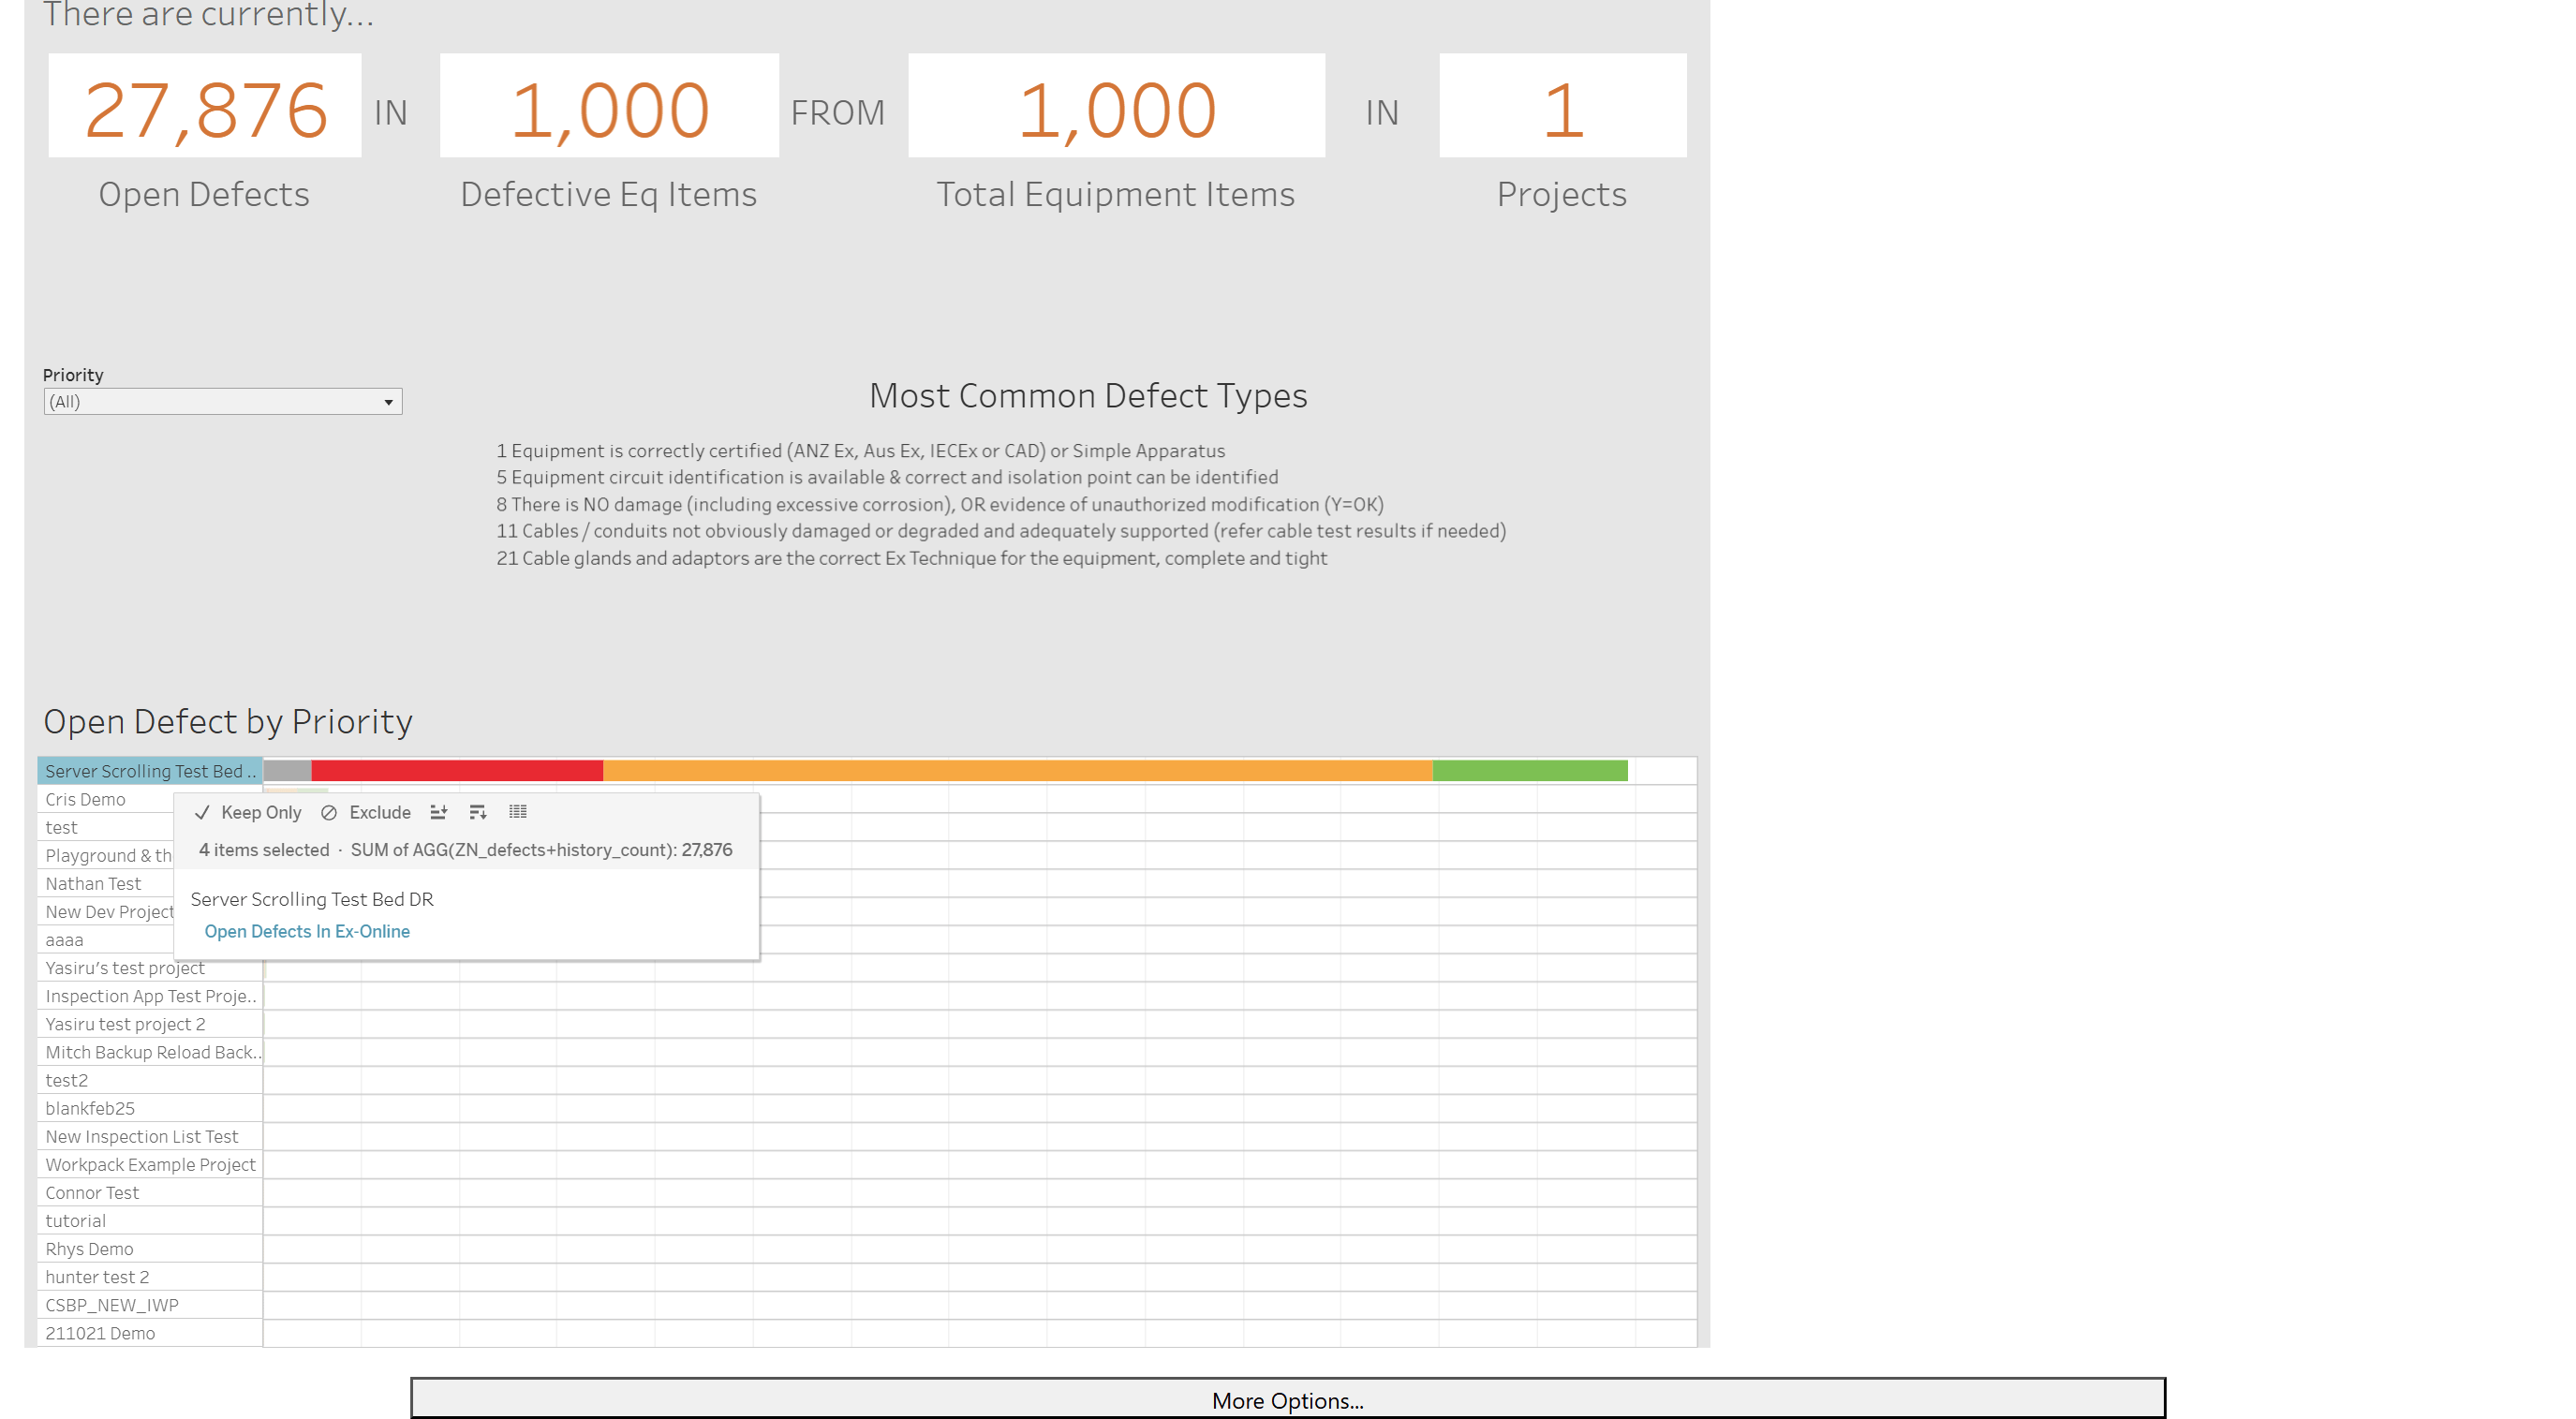
Section titled “Interactive Charts”Charts respond to the pointer and clicks. Aim at the marks on the chart (bar segments, points, and so on)—not only the title or axis labels.
- Hover over a mark to see counts, details, and shortcuts such as Keep only and Exclude.
- Click a mark to open the full menu. You can:
- Navigate to related items in Ex-Online (when the dashboard provides a link)
- Exclude the selection from the view
- Keep only the selection (narrows the charts to that data)
Toolbar and export
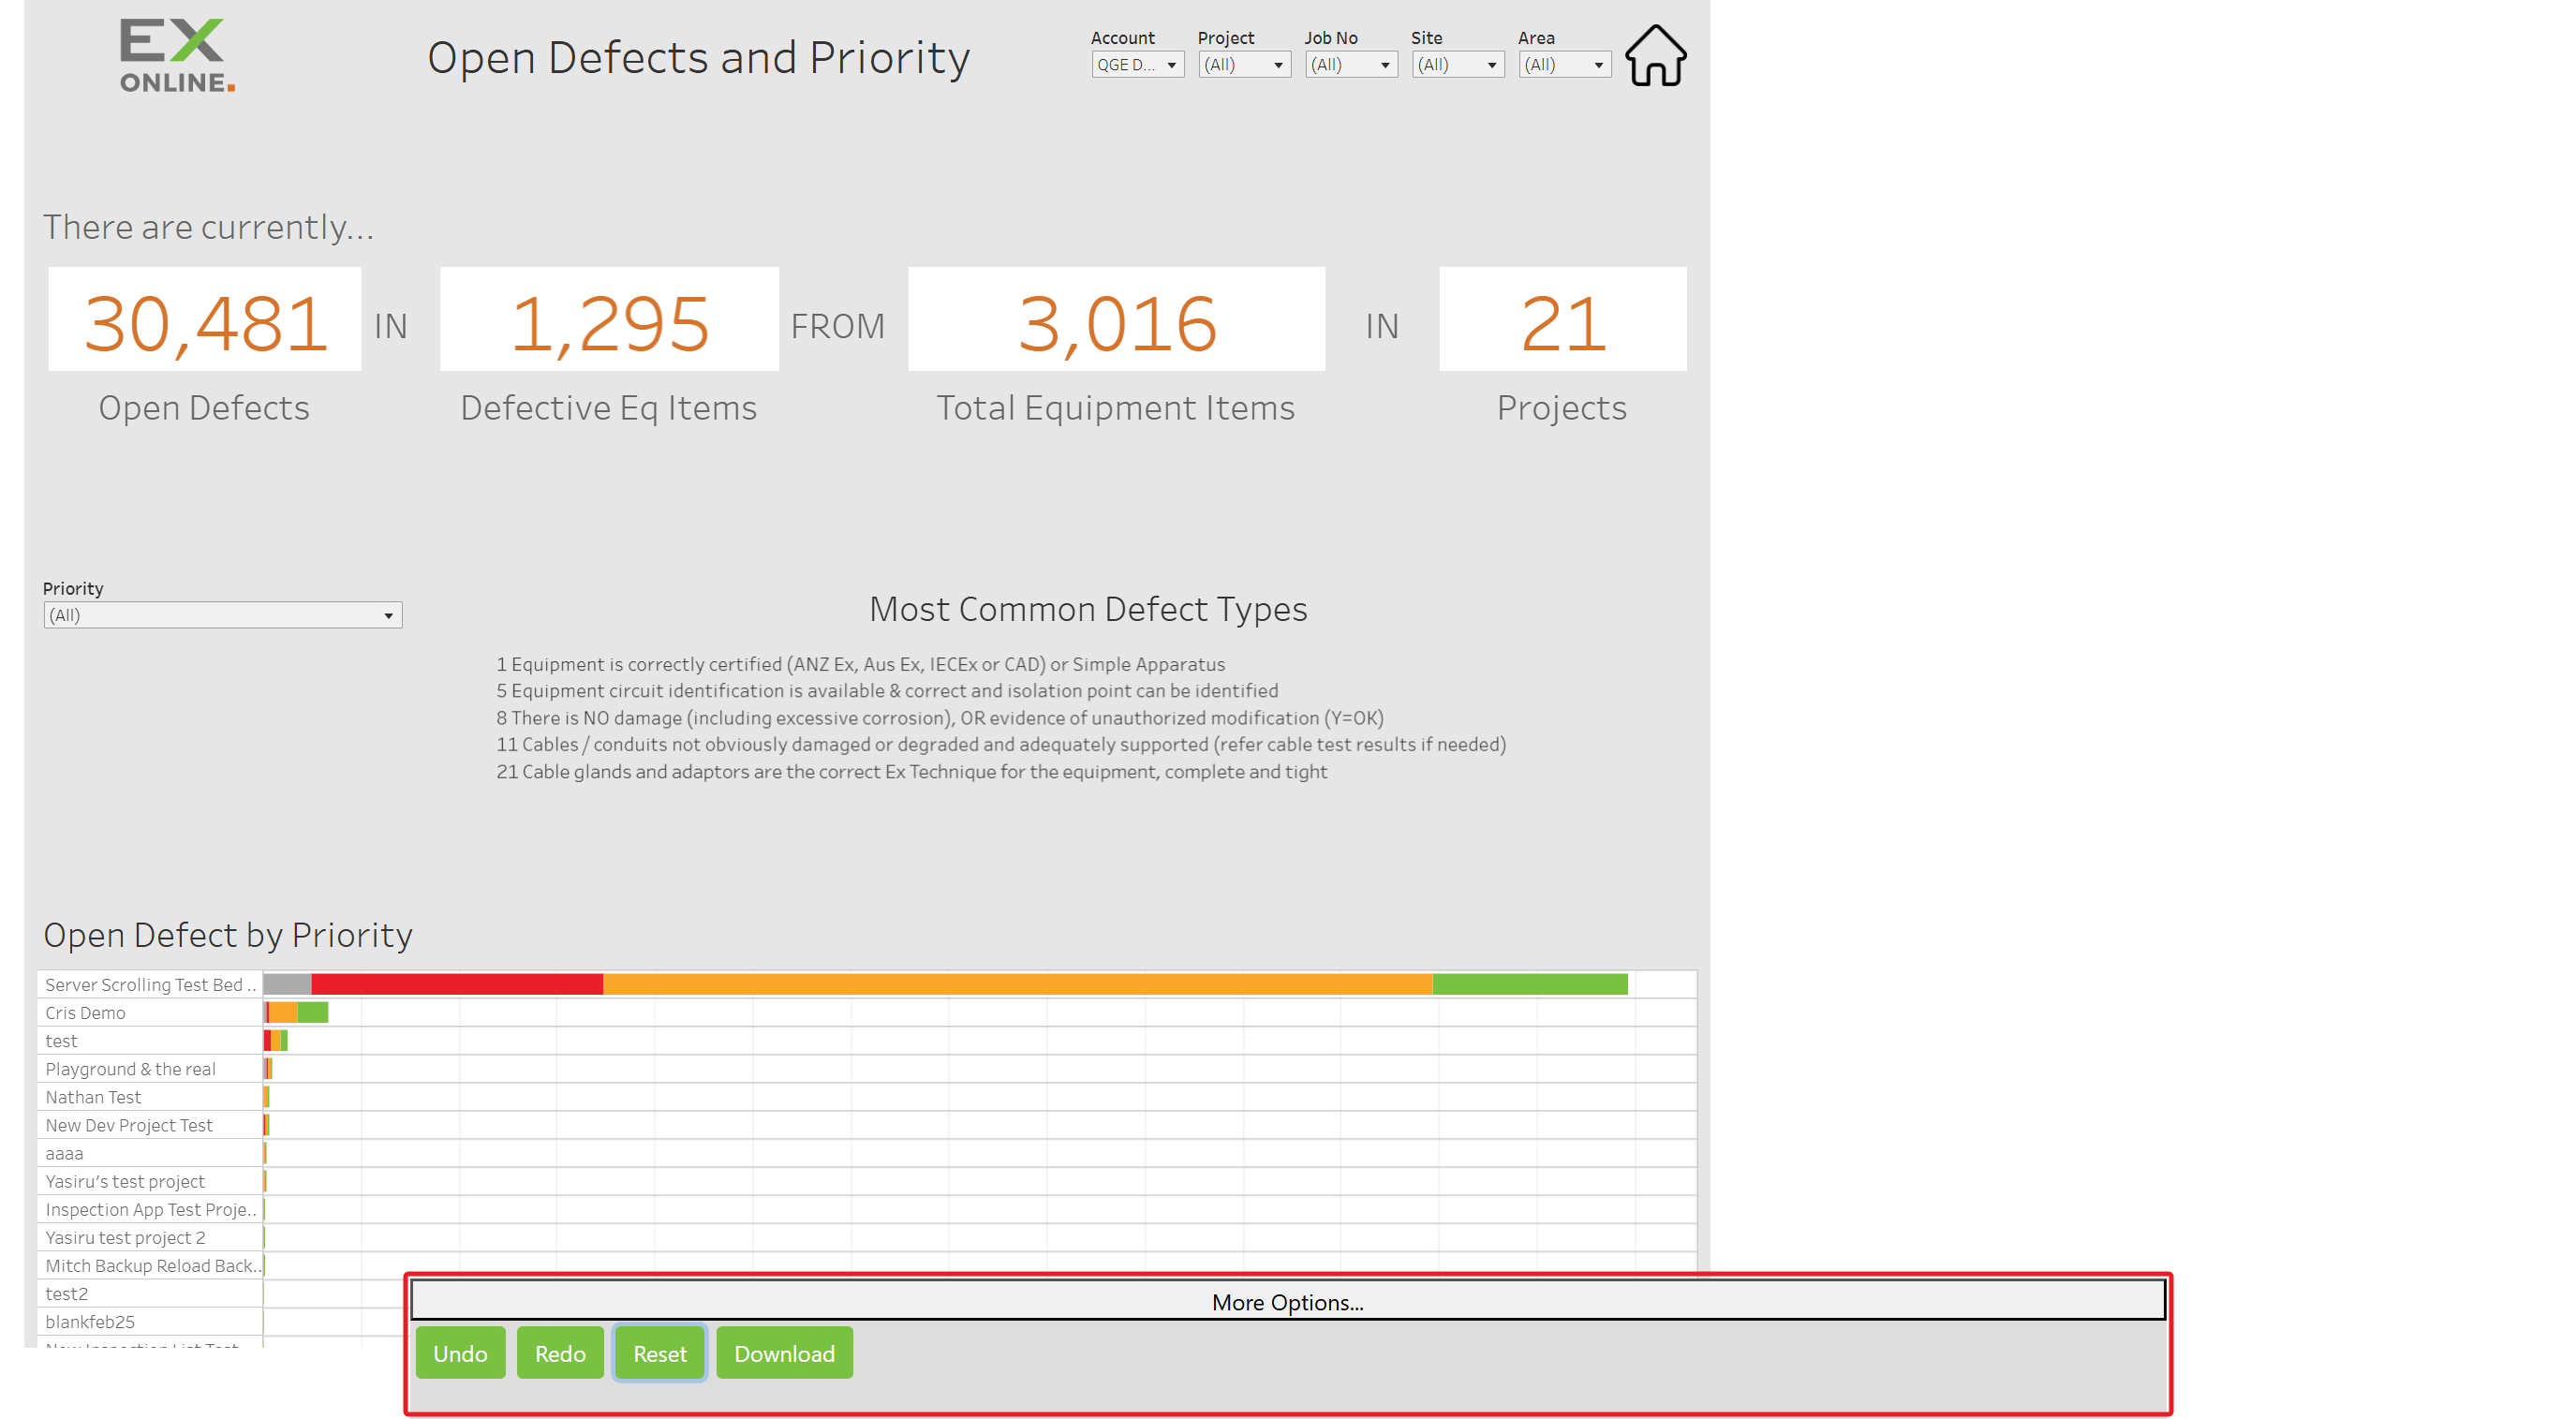
Section titled “Toolbar and export”At the bottom of the view, hover the More Options… bar (outlined in the screenshot). That reveals Undo, Redo, Reset, Download, and any extra actions for this view.
| Control | Description |
|---|---|
| Undo | Undo the last change to filters or the view |
| Redo | Redo an action you undid |
| Reset | Return this dashboard to its default state |
| Download | Save the current view or data (formats can include image, PDF, PowerPoint, or Excel) |
Related Topics
Section titled “Related Topics”- Defect dashboards — Open Defects and Defects Closure in detail
- Inspection dashboards — Inspections Status, Completed, and Forecast in detail