
Project Dashboard Interface
The Project Dashboard is the main working screen for a project. You reach it by selecting a project on the Accounts Page and clicking Open. The EQUIPMENT tab is shown by default.
| Element | Description | |
|---|---|---|
| A | Top Bar — global navigation, help, and user settings | |
| A1 | Hamburger menu | Opens the Recent Projects panel for quick navigation. |
| A2 | Ex-Online logo | Click to return to the Accounts Page from anywhere. |
| A3 | Scheduled Jobs | Opens the Scheduled Jobs page for background tasks. |
| A4 | Help | Opens help, tutorials, and downloads. |
| A5 | User Menu | Profile, preferences, and log out. |
| A6 | Current User | Shows who is currently signed in. |
| B | Orange Bar — switch between data tabs and access project settings | |
| B1 | Project Name | Shows the current project. Click the circle icon to open the Project Window. |
| B2 | EQUIPMENT | Tagged items — the default view. |
| B3 | ASSOCIATED EQUIPMENT | Related or secondary devices. |
| B4 | DOCUMENTS | Project documents and attachments. |
| B5 | DEFECTS | Defect records. |
| B6 | ACTIONS | Corrective actions. |
| C | Toolbar — select, edit, export, and add items for the active tab | |
| C1 | Toolbar buttons | Buttons change per tab — see each tab’s reference page for details. |
| D | Grid — data rows for the active tab | |
| D1 | Green circle icon | Click to open the Equipment Window for that item. |
| D2 | Equipment grid | Paginated list with inline editing — click a row to select it. |
Top Bar
Section titled “Top Bar”The dark header bar (zone A) is shared with the Accounts Page and runs across every screen.
| Element | Description |
|---|---|
| Hamburger menu | Opens the Recent Projects panel for quick navigation. |
| Ex-Online logo | Returns you to the Accounts Page from anywhere. |
| Scheduled Jobs | Opens the Scheduled Jobs page for background tasks. |
| Help dropdown |
|
| User Menu dropdown |
|
| Current User | Shows who is currently signed in. |
Orange Bar
Section titled “Orange Bar”The orange bar (zone B) displays the project name and the navigation tabs: EQUIPMENT, ASSOCIATED EQUIPMENT, DOCUMENTS, DEFECTS, and ACTIONS. The Project Options button (white circle with three dots) sits next to the project name and opens the Project Window.
Toolbar
Section titled “Toolbar”The toolbar (zone C) changes depending on the active tab. Common controls include Edit, Select, Show Selection, Export to Excel, and filter controls (Filter, Undo Filter, Reset Filter). See each tab’s reference page for tab-specific buttons.
Data Grid
Section titled “Data Grid”The grid (zone D) displays records for the active tab. Each column is sortable and filterable via the Edit Column Settings icon. See Filtering and Sorting for details.
Each row has a green circle icon on the left — click it to open the detail window for that record (e.g., Equipment Window, Defect Window, Action Window). The icon turns gray while its window is open. Only one detail window can be open at a time.
The pager bar at the bottom provides page navigation, items-per-page control, and a Refresh button.
Project Window
Section titled “Project Window”The Project Window provides access to project-level configuration and management. The Project Options button (white circle with three dots) on the orange header bar, next to the project name, opens the Project Window.
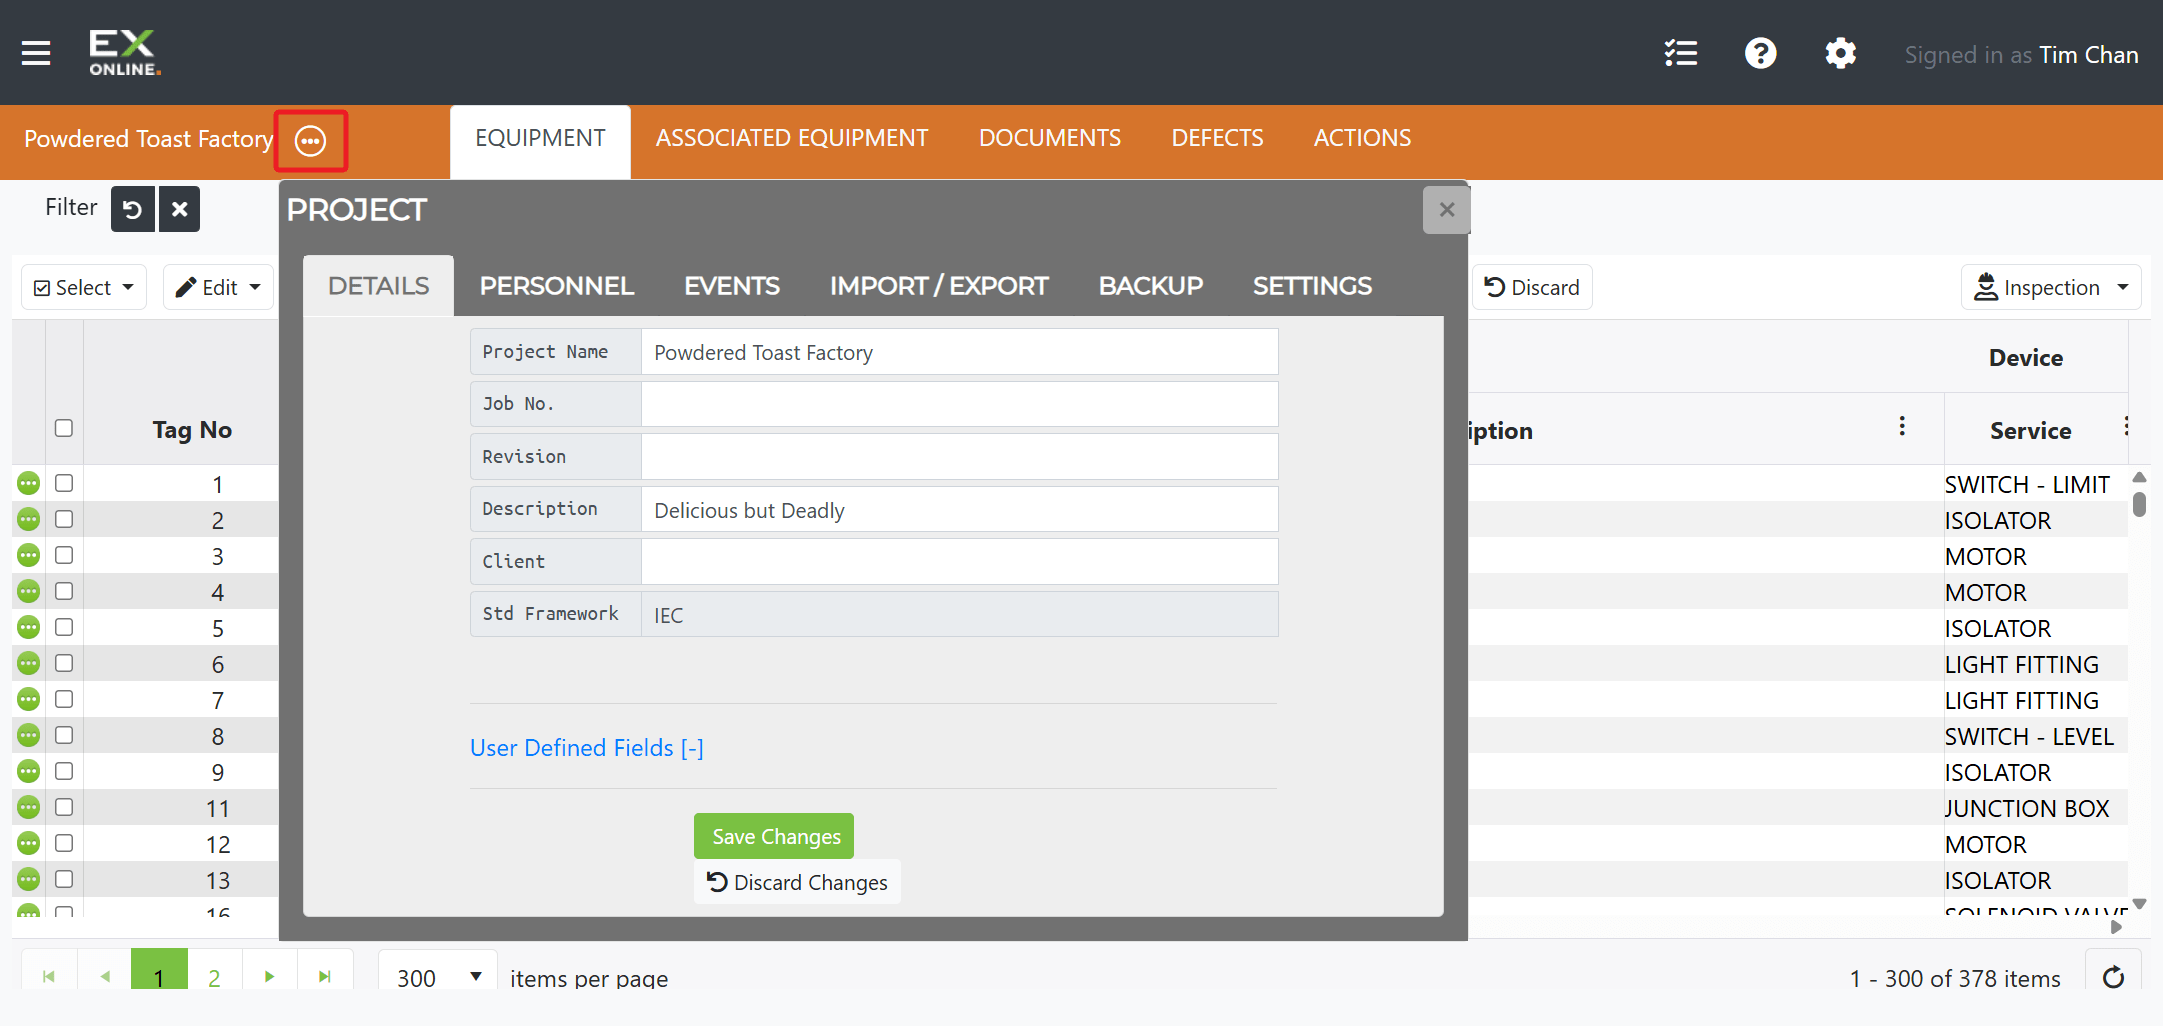
The Project Window contains six tabs: Details, Personnel, Events, Import/Export, Backup, and Settings. See Project Window for the full breakdown.
Related Topics
Section titled “Related Topics”- Equipment — Equipment grid, toolbar, and view settings
- Equipment Window — Tabs, primary items, and edit modes
- Project Window — Project-level configuration and management
- Filtering and Sorting — Filter types, Filter Bar, column filters, and sorting
- Accounts Page — Project list and account-level tabs