
Inspection dashboards
AnalytEx includes three inspection-focused dashboards. This page covers all three.
Inspections Status
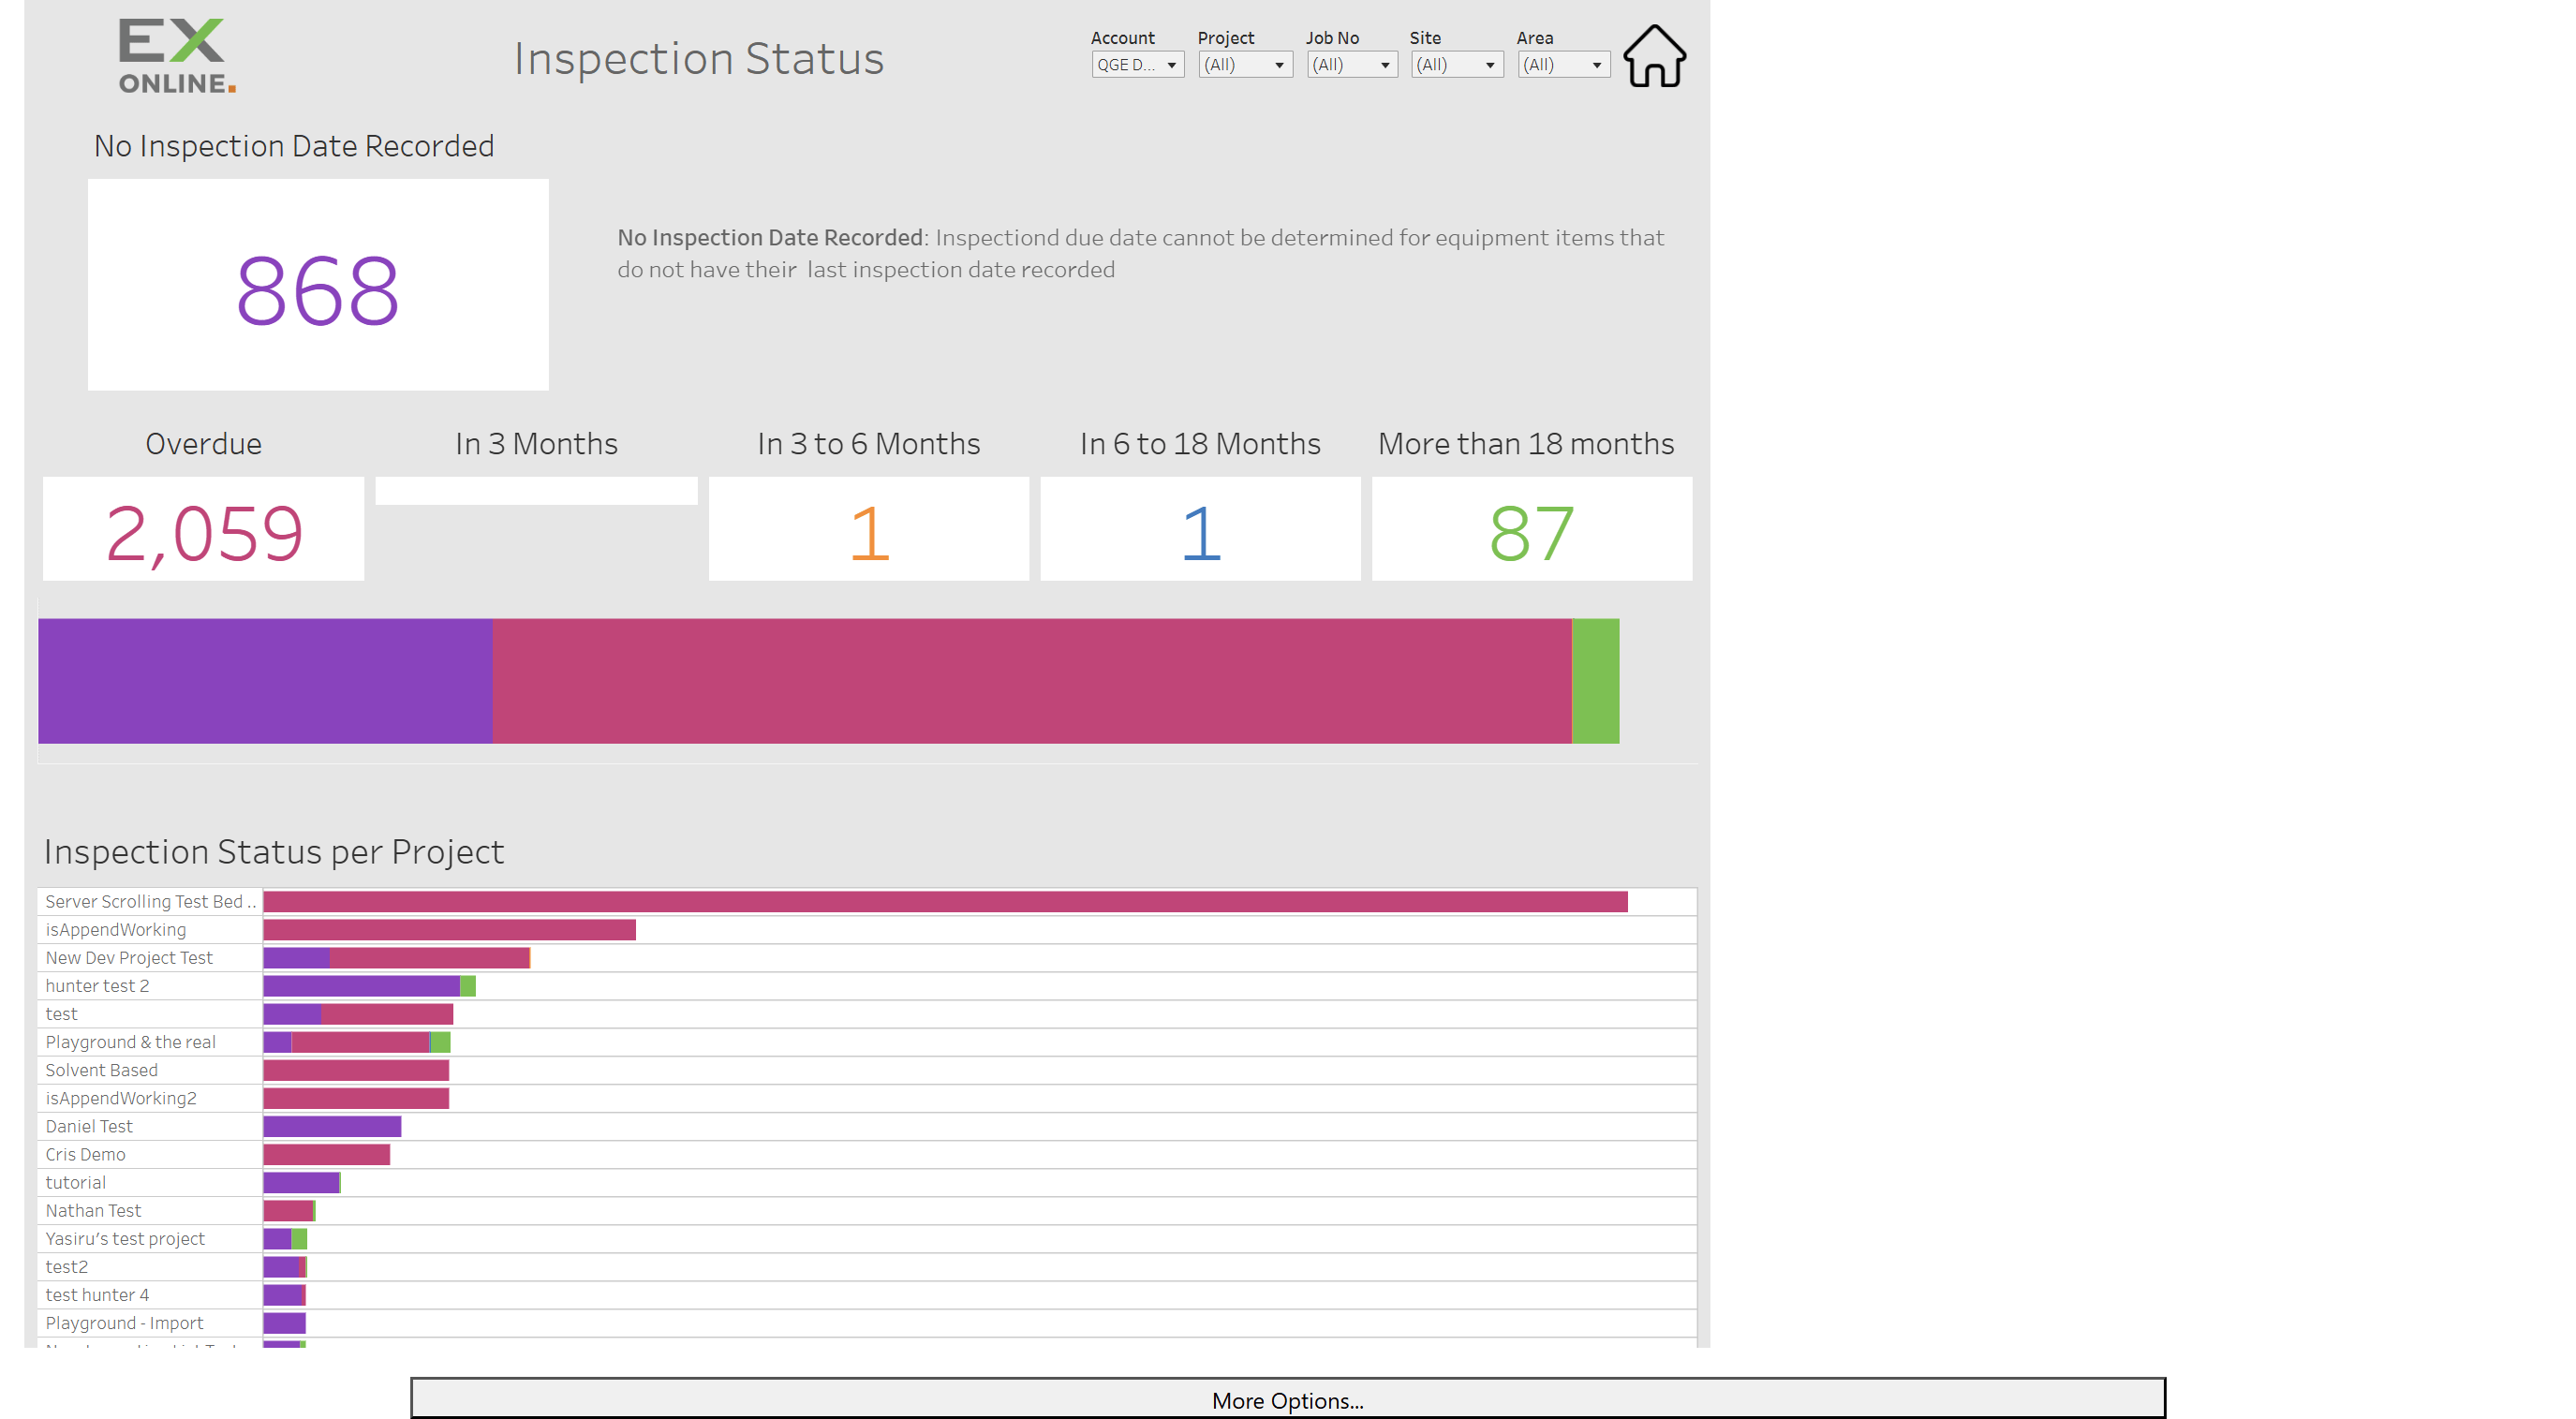
Section titled “Inspections Status”The Inspections Status dashboard shows how inspections are distributed by timing and by project.
Accessing
Section titled “Accessing”From the AnalytEx home screen, click Inspections Status.
Dashboard Elements
Section titled “Dashboard Elements”| Element | Description |
|---|---|
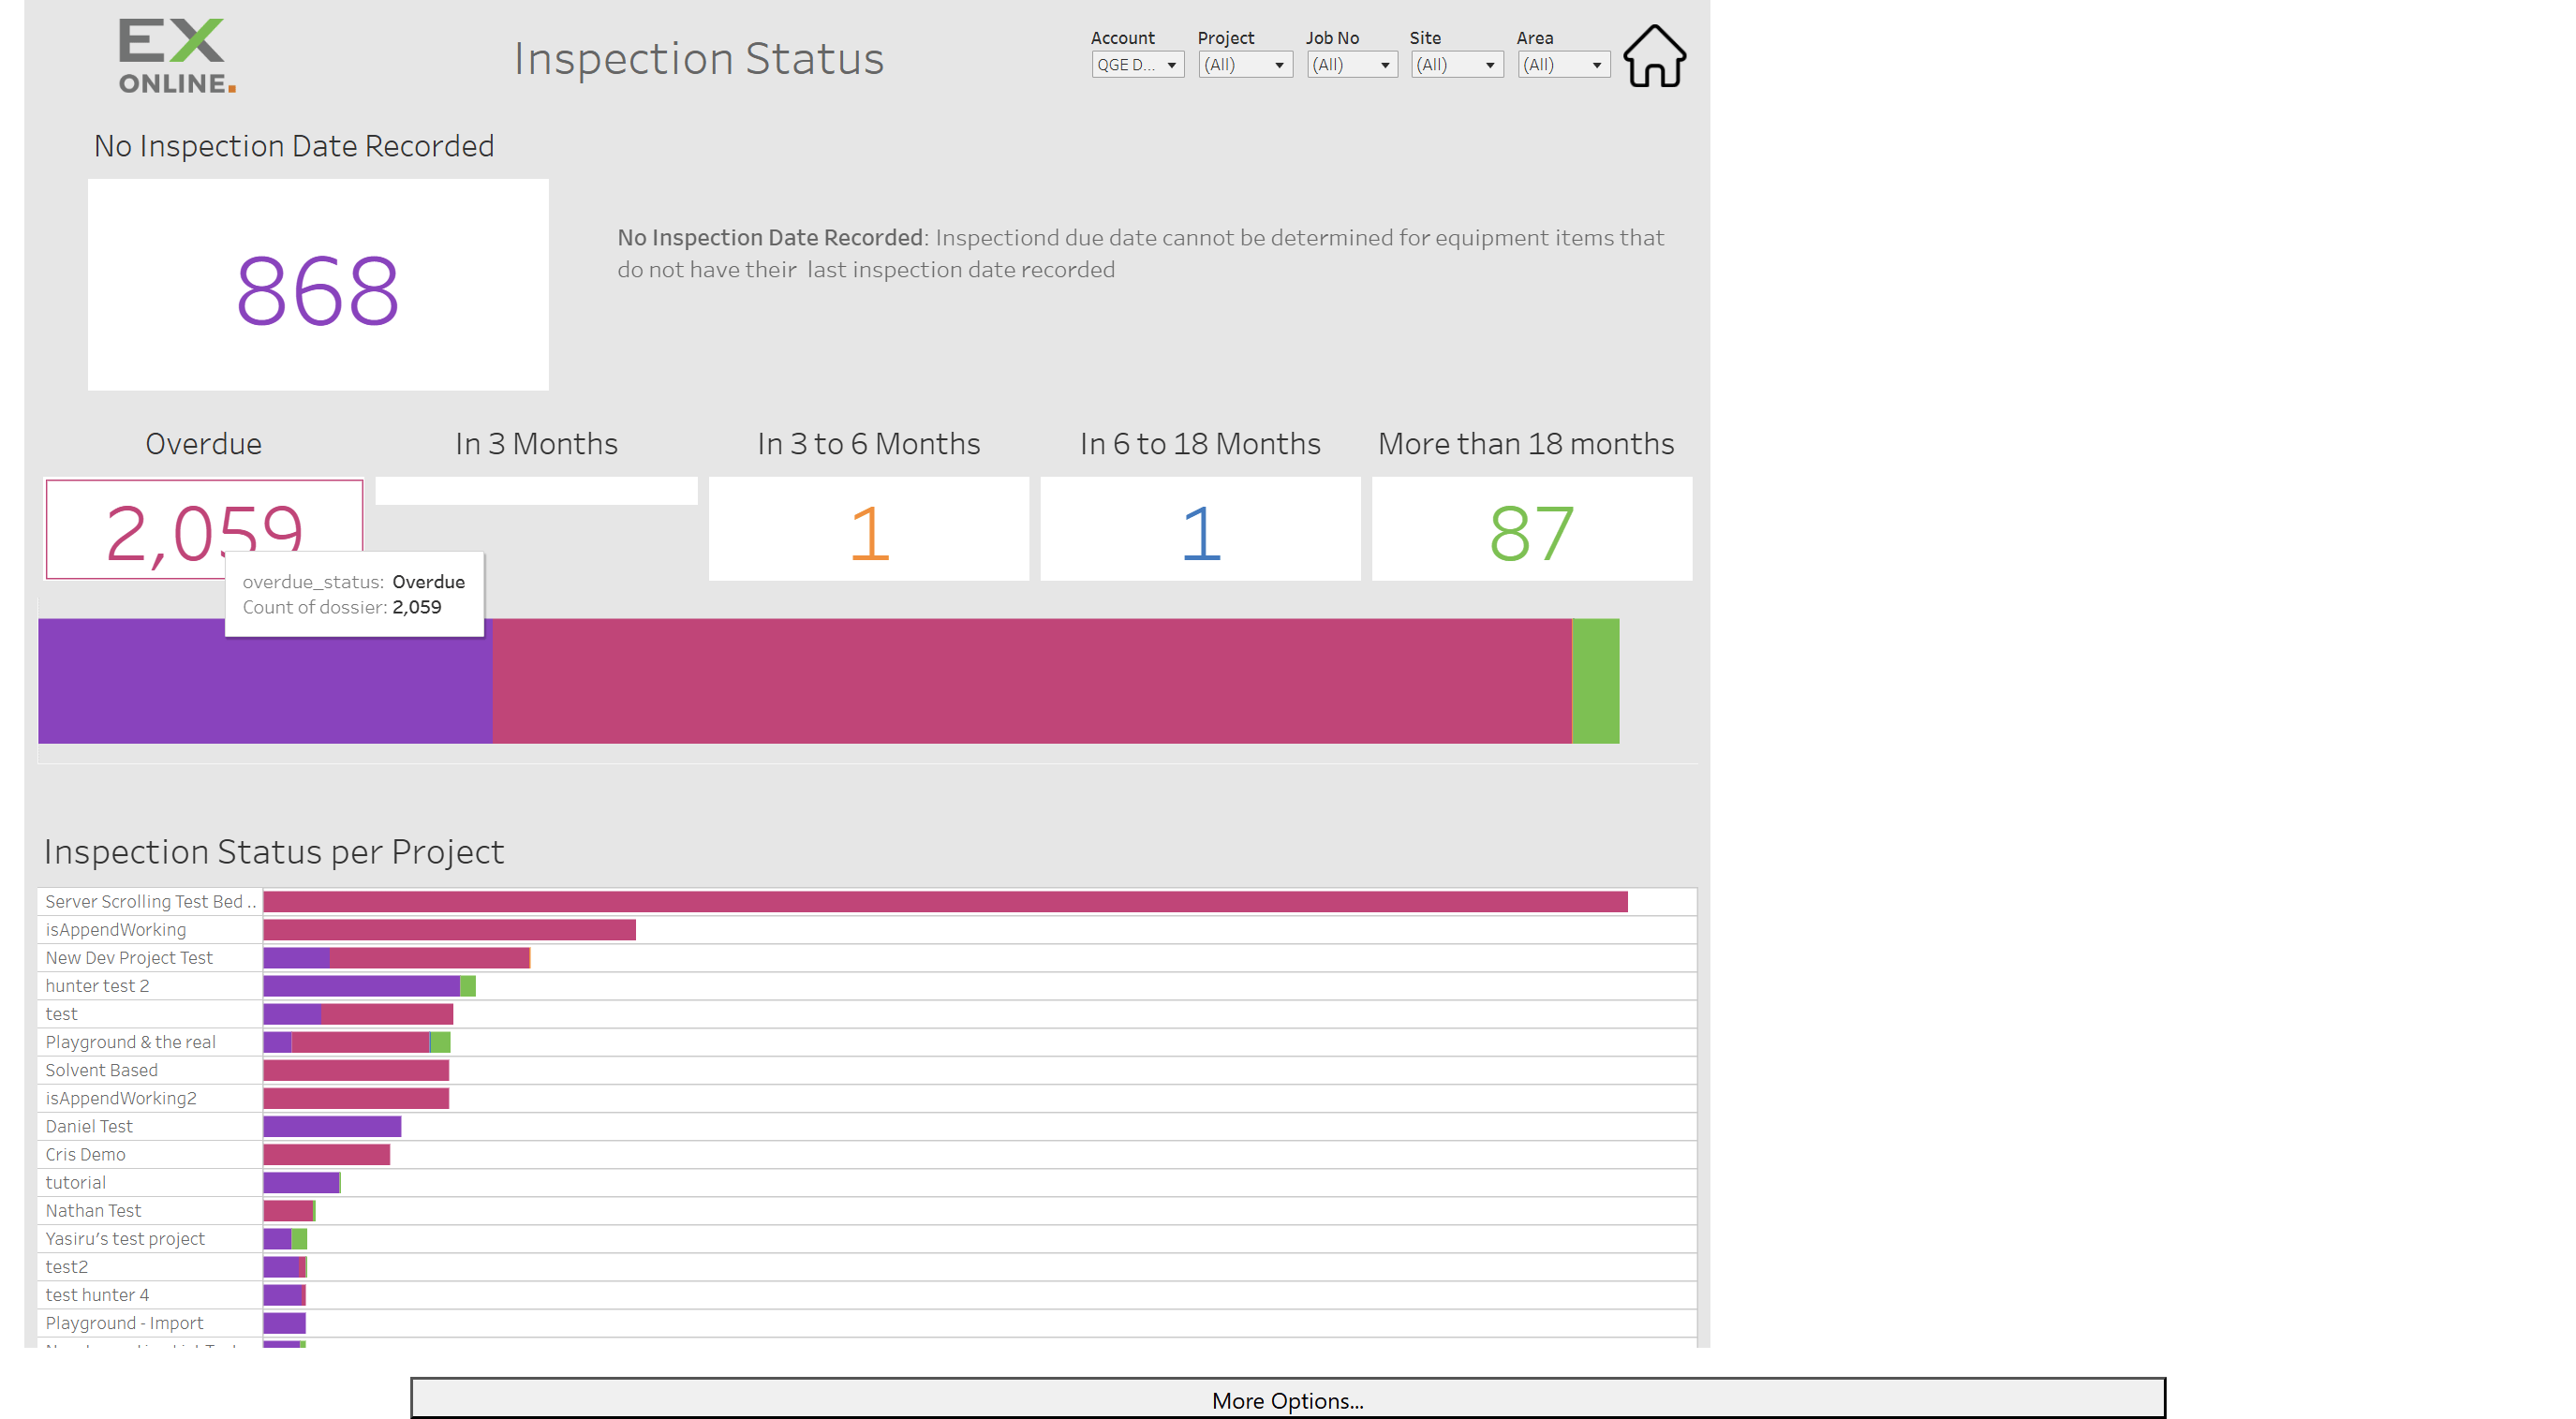
| Status Summary | Colour-coded count cards and stacked bar for each inspection status bucket |
| Inspection Status per Project | Bar chart of inspection counts by project and status |
Interactions
Section titled “Interactions”Status Summary — Hover over a count card to see the status and count for that bucket.
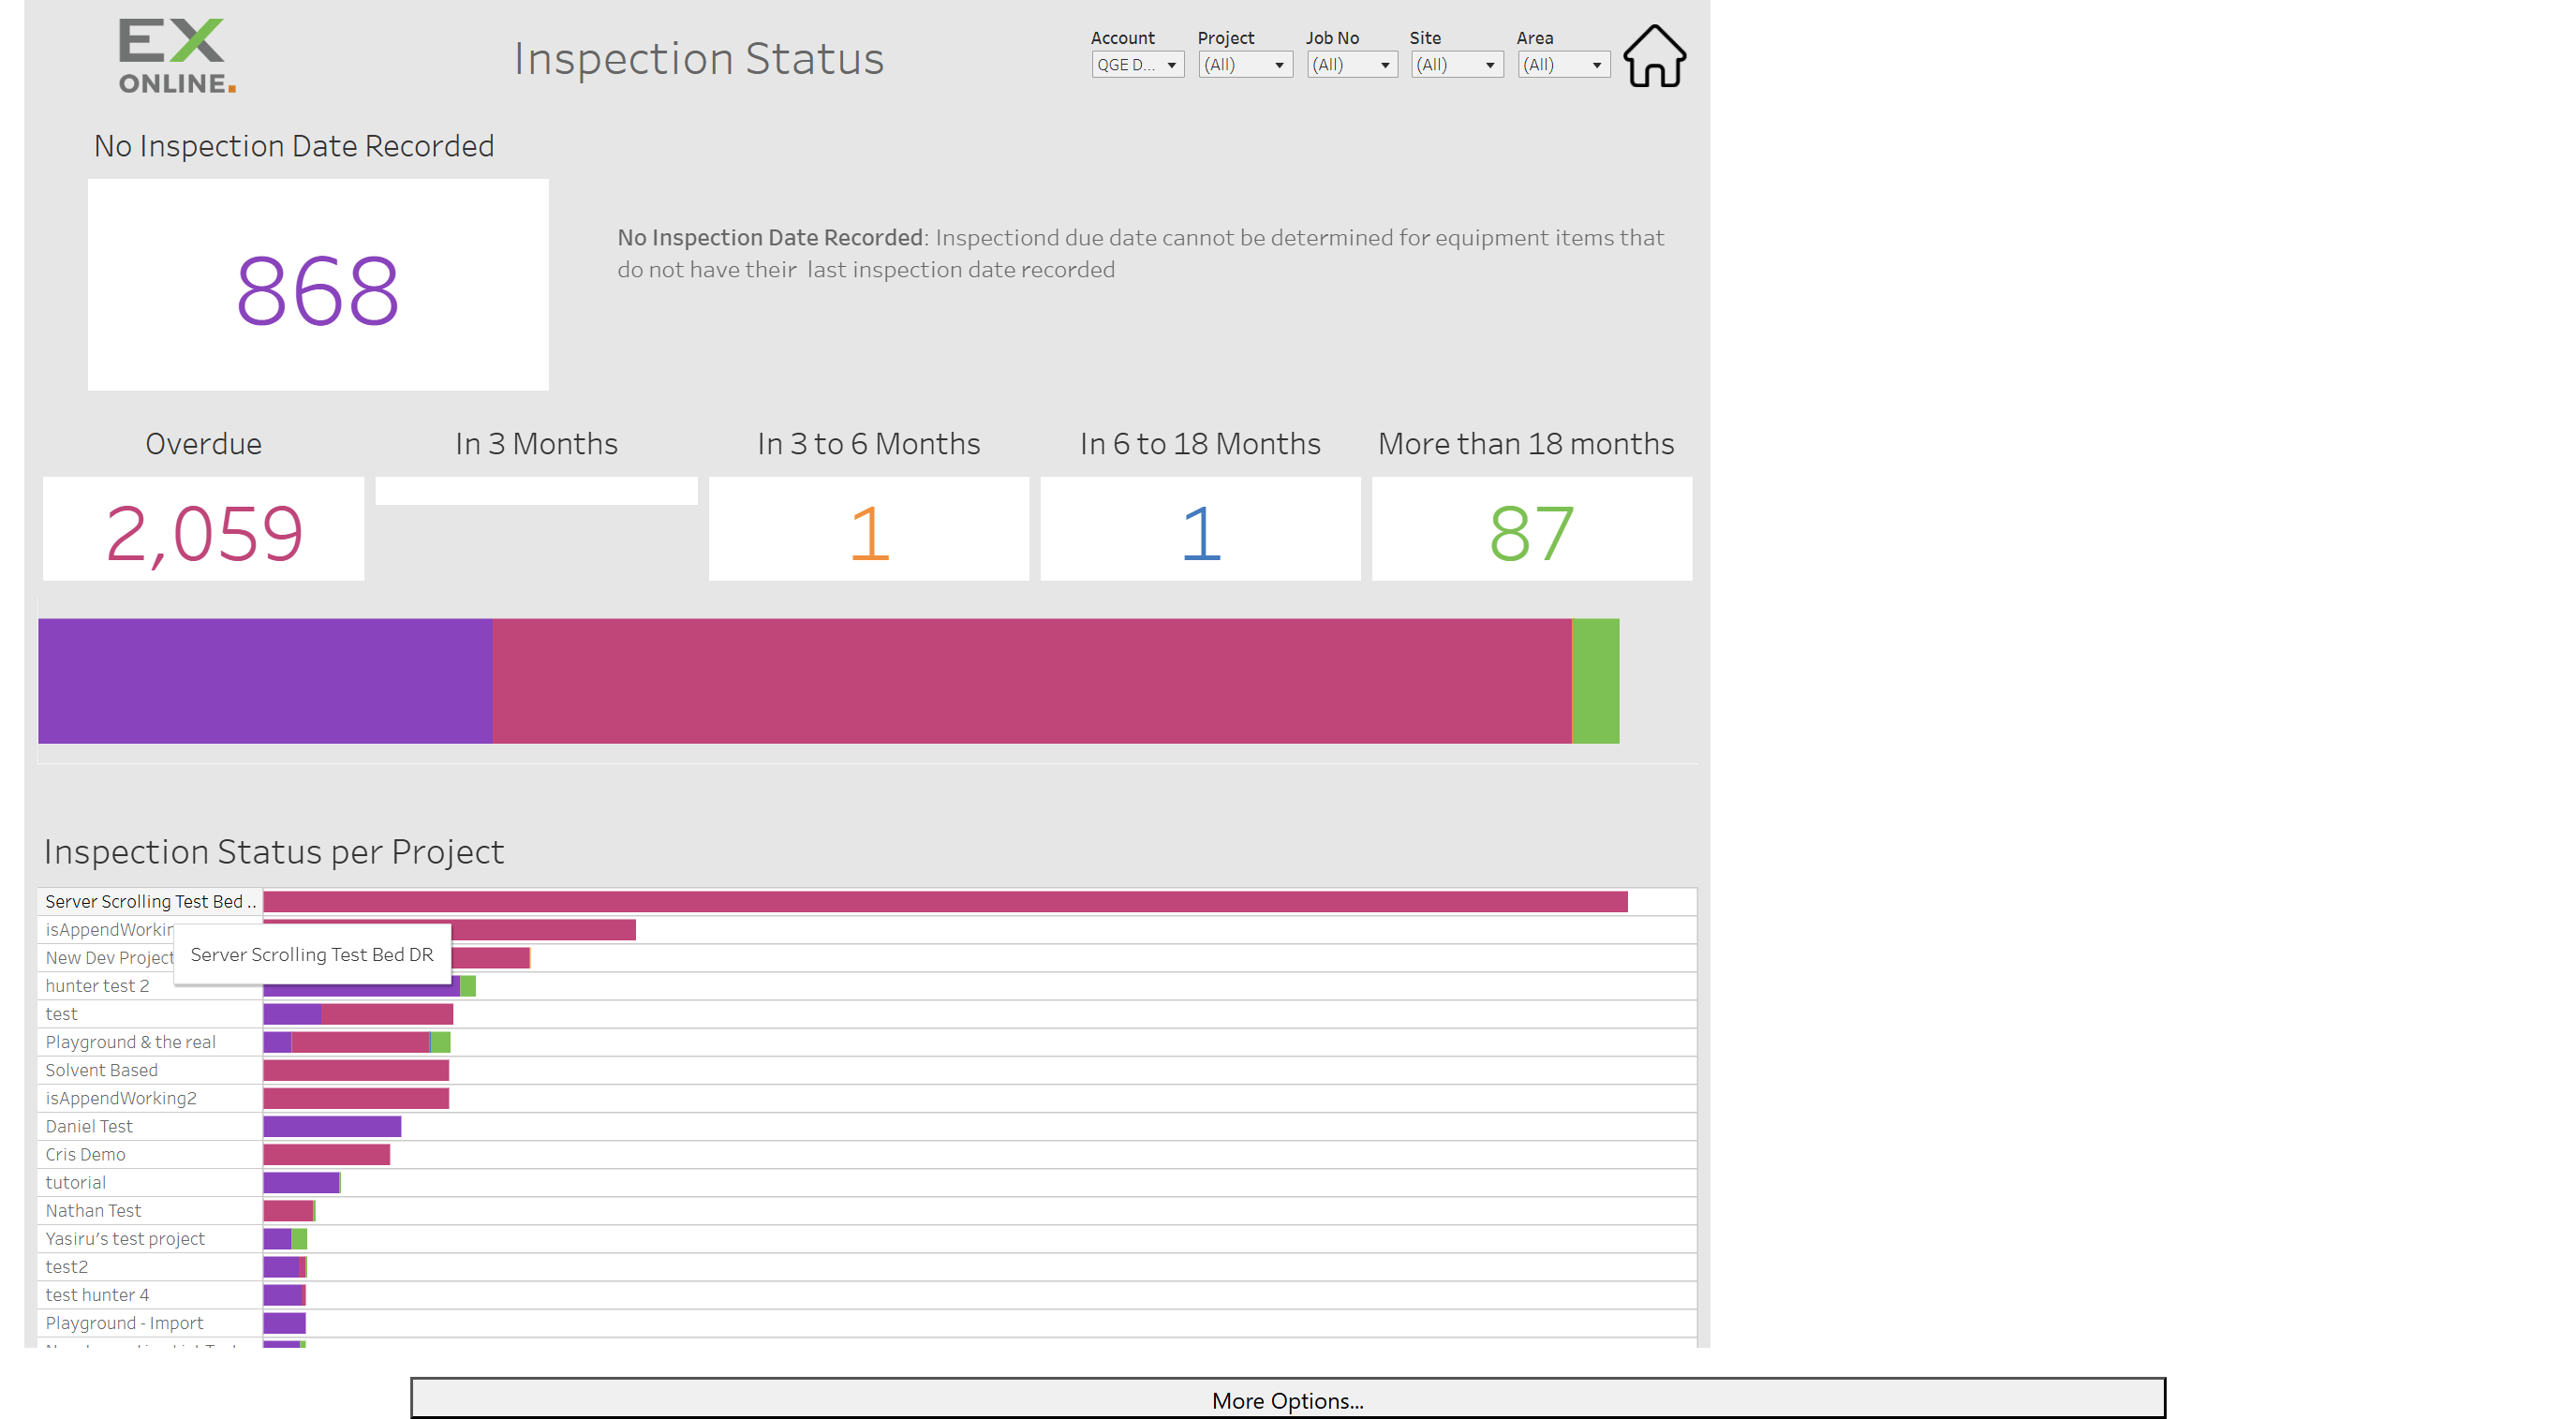
Inspection Status per Project — Hover over a bar segment to see the count for that project. Click a bar to navigate to related items in Ex-Online.
Click a mark to Exclude that data or Keep only that data for focused analysis.
Filtering
Section titled “Filtering”This dashboard has the standard filters — Account, Project, Job Number, Site, and Area.
All filters apply to the whole dashboard.
Inspections Completed
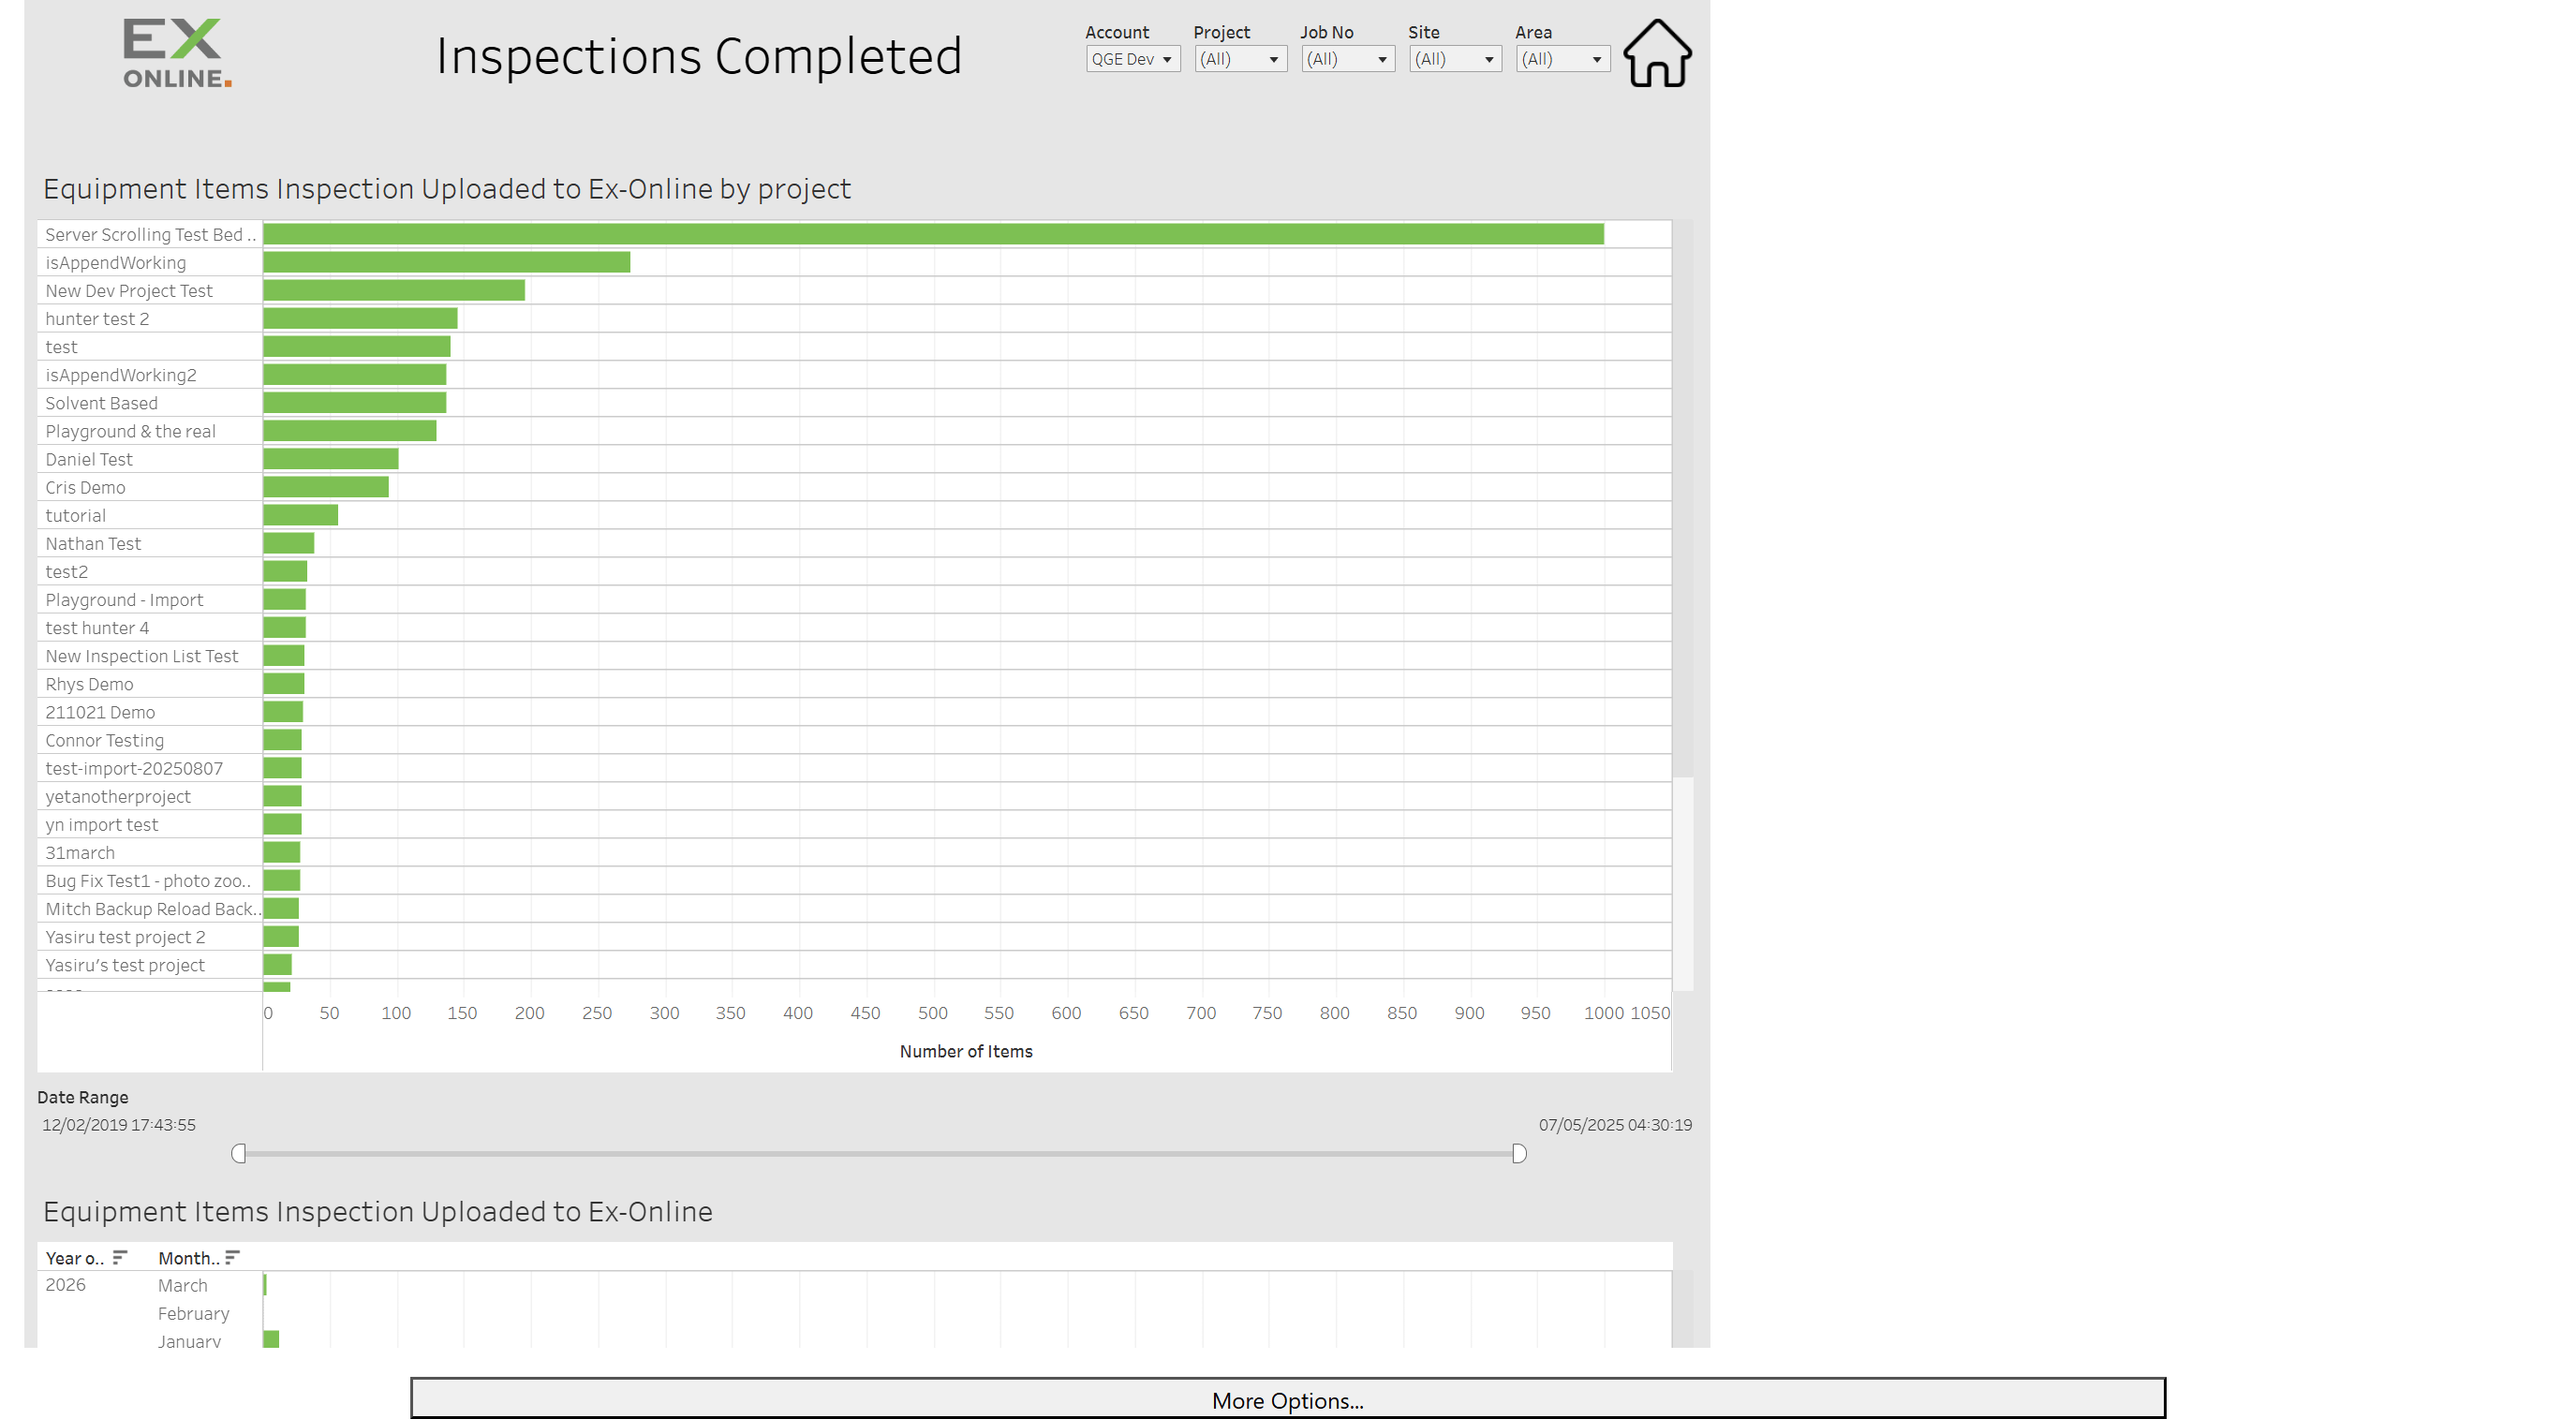
Section titled “Inspections Completed”The Inspections Completed dashboard shows historical inspection upload activity — equipment items with inspection results uploaded to Ex-Online.
Accessing
Section titled “Accessing”From the AnalytEx home screen, click Inspections Completed.
Dashboard Elements
Section titled “Dashboard Elements”| Element | Description |
|---|---|
| Uploaded by project | Horizontal bar chart of equipment items with inspections uploaded, by project |
| Uploaded over time | Bar chart of uploads by year and month |
| Date Range | Slider to narrow the date window for displayed uploads |
Interactions
Section titled “Interactions”Uploaded by project — Hover over a bar segment to see the upload count for that project.
Uploaded over time — Hover over a bar segment to see upload counts for that time period. Click a year or month label to filter the dashboard to that period.
Click a mark to Exclude that data or Keep only that data for focused analysis.
Date Range — Drag the slider handles to narrow the upload period.
Filtering
Section titled “Filtering”This dashboard has the standard filters — Account, Project, Job Number, Site, and Area — and an additional Date Range slider unique to Inspections Completed.
All filters apply to the whole dashboard.
Inspections Forecast
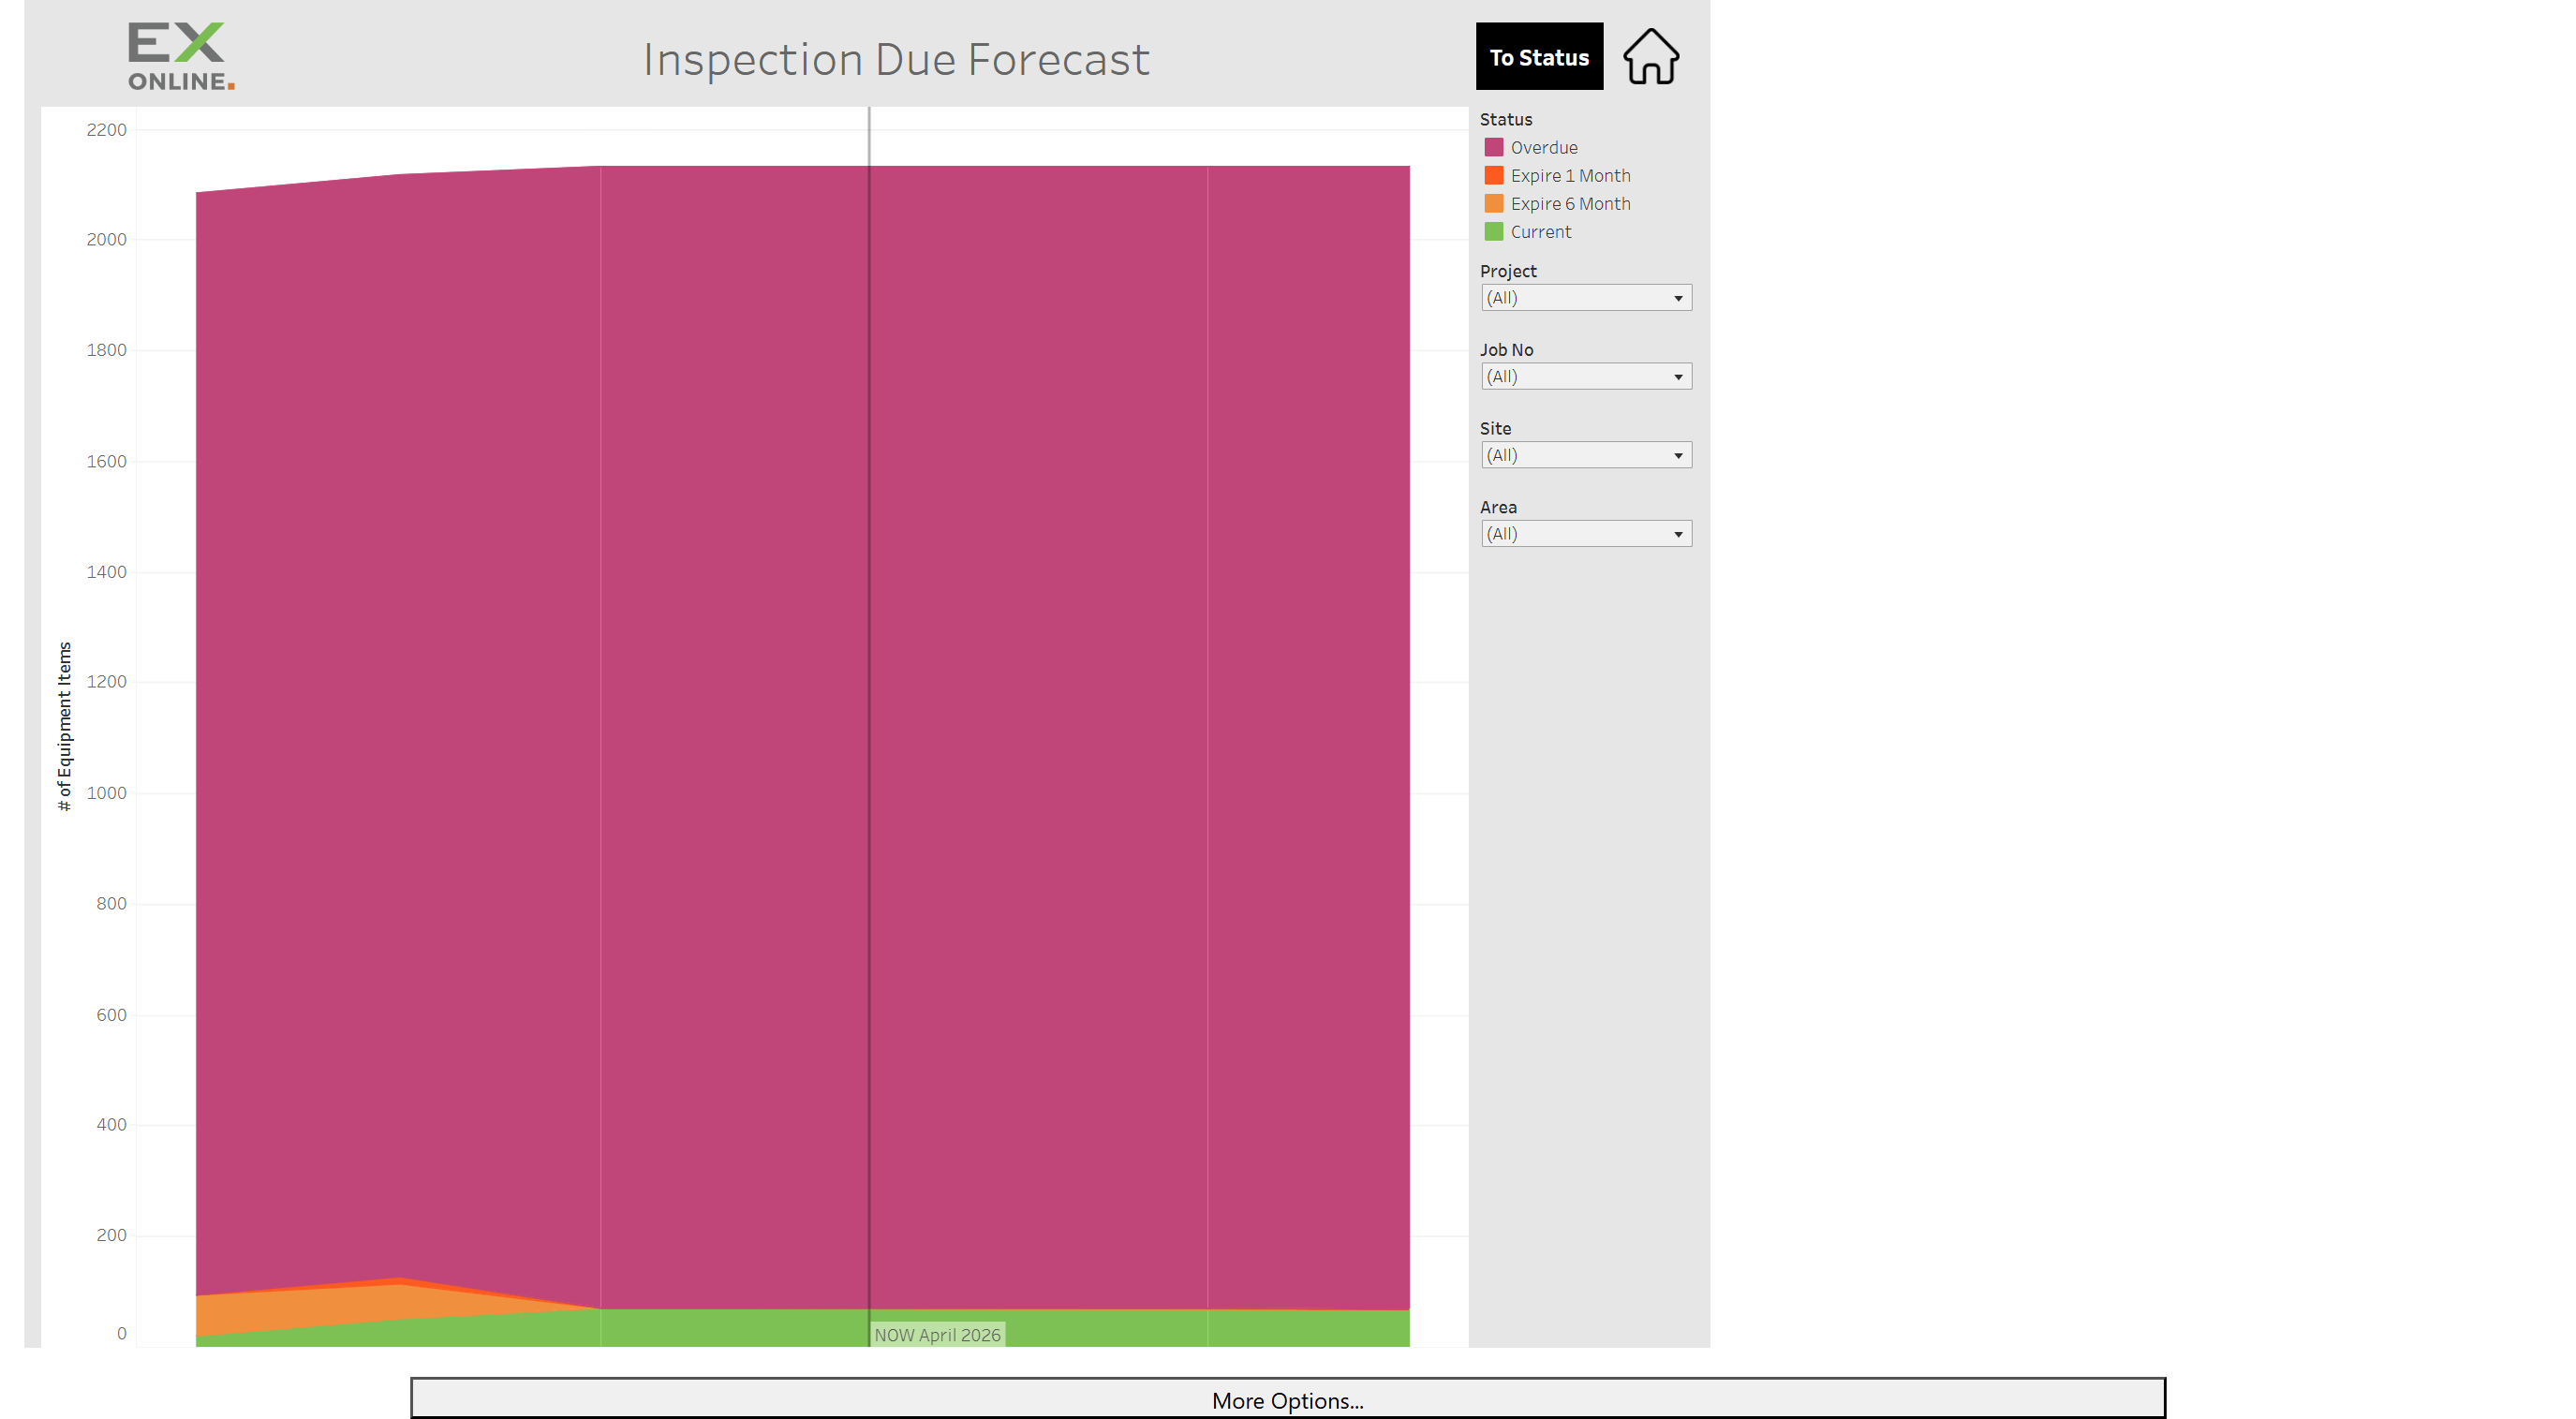
Section titled “Inspections Forecast”The Inspections Forecast dashboard shows a forward-looking view of inspection workload.
Accessing
Section titled “Accessing”From the AnalytEx home screen, click Inspections Forecast.
Dashboard Elements
Section titled “Dashboard Elements”| Element | Description |
|---|---|
| Stacked area chart | Equipment counts over time by month |
| Status key | Colour-coded labels: Overdue, Expire 1 Month, Expire 6 Month, Current |
Interactions
Section titled “Interactions”Stacked area chart — Hover over a month to see counts and the status mix for that period.
Status key — Click a status level to highlight that band across the chart.
Filtering
Section titled “Filtering”This dashboard uses Project, Job Number, Site, and Area filters only — there is no Account filter on this view.
All filters apply to the whole dashboard.
Related Topics
Section titled “Related Topics”- Defect dashboards — Open Defects and Defects Closure
- AnalytEx introduction — Access, home screen, and common toolbar behaviour
- Inspections — Managing inspections and IWPs in the Tag Browser